Peter Smith
Solana has been trading sideways around $208, keeping traders guessing about its next big move. As crypto markets stay volatile, SOL's price action is under the microscope, with key support and resistance levels becoming crucial for determining where it heads next.
SOL Price Analysis
Crypto trader @ali_charts recently shared his take on SOL, suggesting it might pull back to $206 before making another run higher. His chart shows a potential bounce scenario that could push SOL up to $217, which lines up with resistance on the hourly chart.
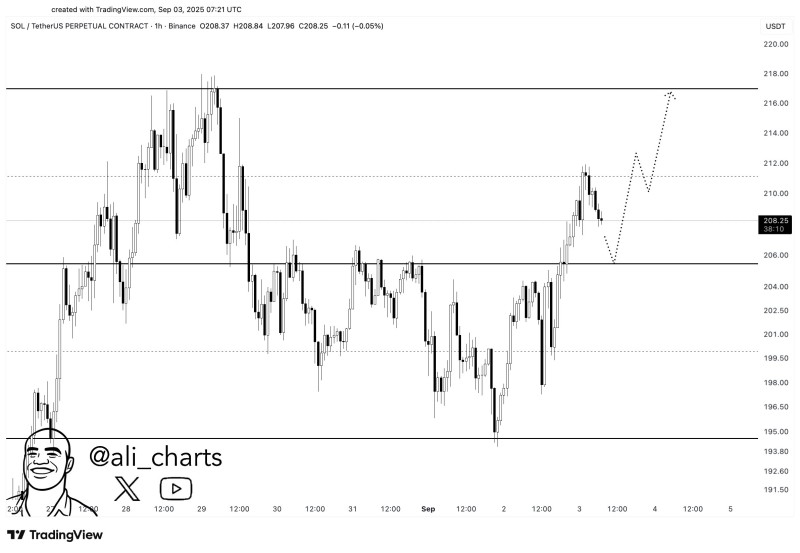
Right now, SOL is trading around $208.25, having hit a session high of $208.84. This keeps it just above that important $206 support level, backing up the trader's idea that we might see a small dip before the next move up.
Key Support and Resistance Levels for SOL
- Immediate support: $206 – This is the make-or-break level for SOL's short-term direction.
- Upside target: $217 – Lines up with major resistance shown on the chart.
- Downside risk: If $206 breaks, SOL could fall back to the $200–195 area.
The chart shows a "dip-and-rally" pattern where a quick pullback might actually fuel the next push higher.
Broader Market Context and SOL Outlook
SOL's next move really depends on whether it can stay above $206, but the overall crypto market will also play a big role. Bitcoin's price action will likely be key in determining if Solana can keep its momentum and reach that $217–$218 target.
If buyers step in at support, we could see a 4–5% gain in the near term. But if $206 fails to hold, any recovery might get delayed and expose lower price levels.
 Peter Smith