 Eseandre Mordi

⬤ SOL is trading around a critical technical zone after a sharp selloff on the 4-hour chart. The token is stabilizing near $124 following a drop from the mid-$140s, suggesting the market is taking a breather after the recent decline. SOL appears to be retesting the breakdown zone from its previous ascending channel before potentially heading lower.
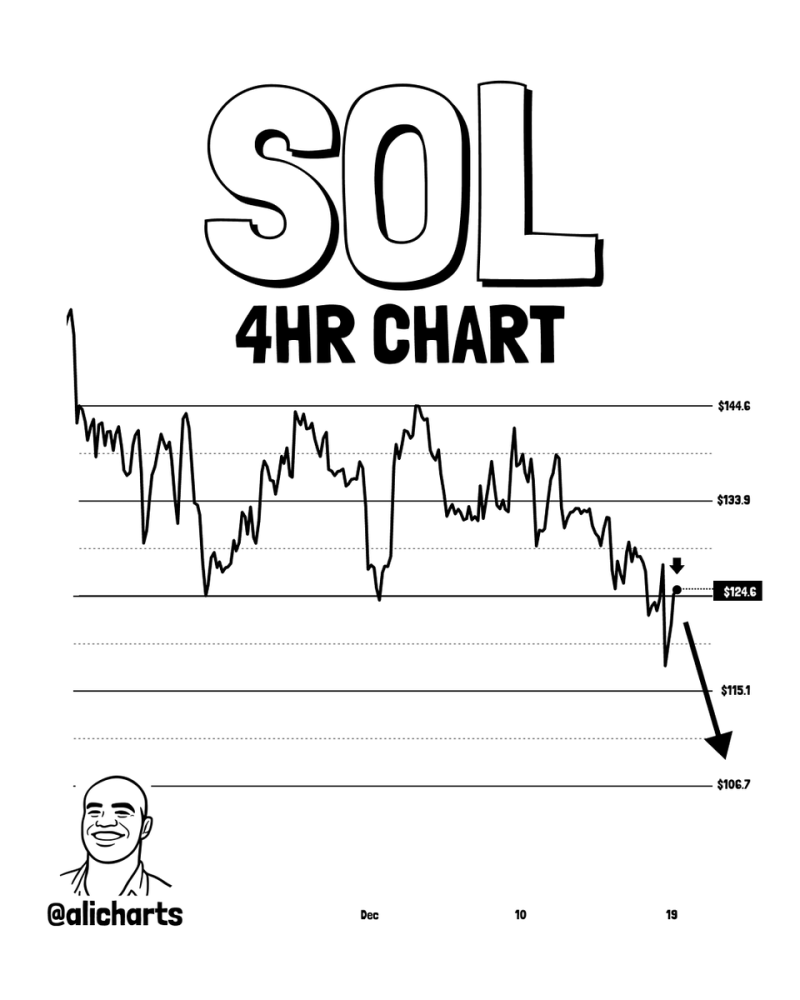
⬤ The chart shows a clear break in structure after SOL fell below its ascending channel that had been supporting higher prices. When support around $133 broke down, selling intensified and pushed the price into the low $120s. The recent bounce has been limited and hasn't reclaimed previous support levels, showing that buying pressure is still pretty weak.
⬤ When an asset retests a breakdown zone, it's usually seen as confirmation that the trend will continue rather than reverse. For Solana, the price action near $124 lines up with earlier consolidation areas that now work as resistance. If this level doesn't hold, the chart points to a potential move toward $115, with a deeper drop to $107 possible if momentum stays negative.
⬤ This price movement matters for overall market sentiment since Solana often mirrors risk appetite in the volatile crypto space. A slide toward $107 could signal a more cautious market environment, especially if broader conditions remain shaky. How SOL responds near these projected levels will likely shape near-term momentum and show whether the asset can stabilize or if the correction has further to run.
 Eseandre Mordi


