 Marina Lyubimova

⬤ Solana's liquidity is thinning because its Realized Profit/Loss Ratio has fallen into the range seen during bear markets. The 30-day average has stayed under 1 since mid-November - traders across the network are closing more positions at a loss than at a gain. This marks a clear change in how the market behaves.
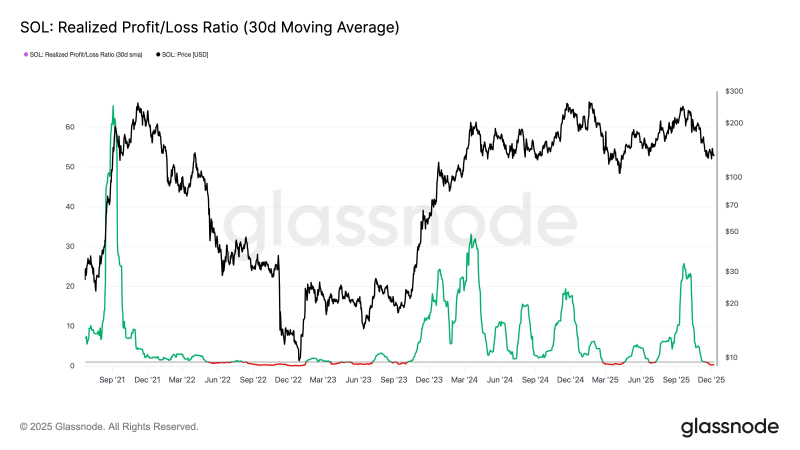
⬤ The Realized Profit/Loss Ratio serves as a simple gauge of liquidity. A reading above 1 shows that profit taking leads and liquidity grows. A reading below 1 shows that loss taking leads and liquidity contracts. At the moment Solana sits squarely in the loss dominated zone. The chart displays earlier cycles in which the ratio spiked for a short time before it dropped again, a pattern that matches the current move.
⬤ A phase dominated by losses is important because only a small share of participants will sell at a profit. The ratio turns positive only after new demand appears or after forced sellers leave. Neither event has taken place for Solana so far.
⬤ Tighter liquidity alters how Solana reacts to market moves. Low liquidity tends to produce sharper swings in either direction and raises volatility. The metric does not forecast price direction - yet it plainly reveals the trading conditions Solana confronts this day. For anyone who tracks the network, on chain liquidity signals stay crucial.
 Marina Lyubimova


