 Peter Smith

⬤ Solana (SOL) is extending its decline as short-term sentiment cools across the crypto market. SOL could find support around 124 USDT, a level that's being watched as a potential stabilization zone. The 1-hour chart shows SOL trading near 131 USDT, with price moving steadily lower after failing to hold above intermediate resistance.
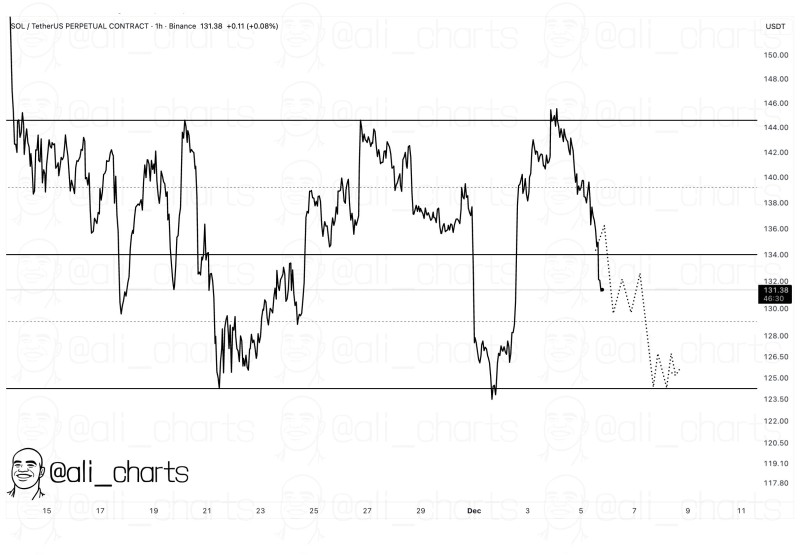
⬤ The current structure reflects a sharp downturn from the 138-144 USDT zone, where Solana previously tried to consolidate. The chart shows a quick move down toward 134 USDT, which was then lost, triggering more weakness. A projection outlines a scenario where SOL bounces between 132 and 128 USDT before potentially heading toward 124 USDT support. This lines up with recent lower highs and lower lows shaping the short-term trend.
⬤ Market behavior over recent sessions shows SOL attempted several intraday recoveries, but each bounce stalled as sellers stayed in control. The path shown on the chart highlights uncertainty within the current range while still suggesting a bias toward the lower boundary. This follows the pattern seen throughout late November and early December, where the market struggled to regain upward momentum.
⬤ The reaction at 124 USDT could be important for Solana's near-term outlook. A solid response at this level might reduce downward pressure and shift the market into consolidation. A weak reaction, however, may expose SOL to deeper pullbacks and extend the corrective move. This zone has become a key reference point as traders watch whether the market can stabilize amid increased volatility.
 Peter Smith


