 Eseandre Mordi

⬤ Solana (SOL) keeps catching eyes as it trades around levels that previously marked the bottom of its multi-month range. SOL's been "chopping at the lows" — basically consolidating near the $130 mark for quite a while. The chart shows how Solana spent significant time stabilizing at this support zone after a prolonged downtrend, with the market trying to establish a solid base.
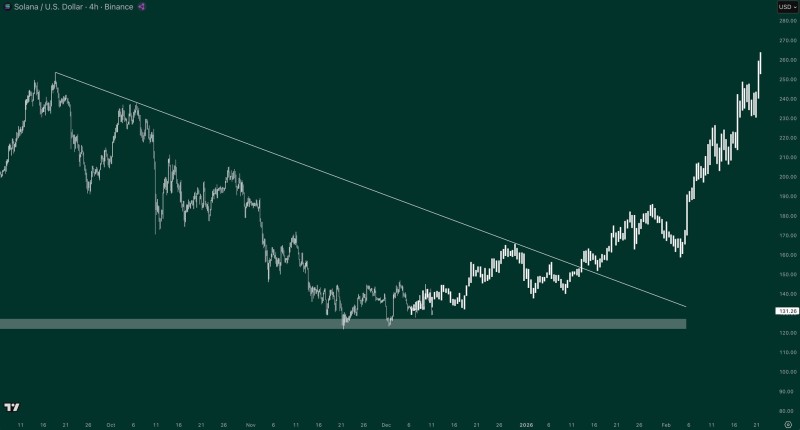
⬤ The chart reveals a long descending trendline that guided the broader selloff through the final months of 2024. After multiple attempts to reclaim momentum, SOL finally broke above this declining structure and started forming a healthier trend. Price action shifted decisively once Solana exited the compression range, sparking a strong and sustained rally. This move carried SOL from the $130 support area into a sharp climb that now extends beyond $250, showing renewed participation and growing market conviction.
⬤ That support region near $130 proved crucial — Solana held firm even during heavier volatility. Maintaining this base allowed SOL to transition into a fresh upward cycle. Current chart structure shows a clear series of higher highs and higher lows following the breakout from consolidation, reflecting notable improvement in trend behavior. The sharp acceleration on the right side underscores how momentum expanded once key resistance levels got taken out.
⬤ This development matters because shifts in long-term market structure influence sentiment across the broader crypto space. Solana's recovery from prolonged lows and its ability to sustain momentum after breaking a major downtrend have implications for liquidity dynamics and risk appetite within the altcoin sector as traders assess what comes next.
 Eseandre Mordi


