 Peter Smith

Shiba Inu spent weeks locked beneath a clear downtrend, but recent price action is starting to challenge that structure. A daily close above the descending resistance line - combined with a notable spike in exchange outflows reported by TheCryptoBasic - marks a potential inflection point that traders are now watching closely.
The Downtrend That Controlled SHIB Price Action Since February
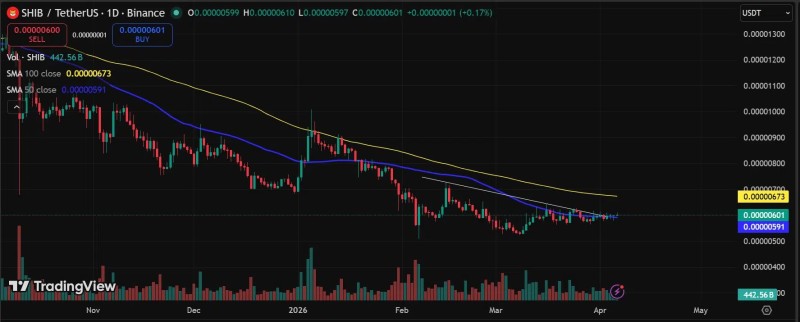
Since hitting an intraday high near $0.00000725 on February 14, SHIB has printed a consistent series of lower highs. A descending trendline drawn from that peak repeatedly rejected any upward attempts and defined the broader bearish structure for weeks.
Price gradually compressed into the $0.0000055-$0.0000060 range during that period. Candles tightened, volatility dried up, and the chart reflected a market that was losing downside momentum - but not yet ready to flip.
SHIB Breaks Structure Around the $0.0000060 Zone
The technical picture shifted when SHIB finally produced a daily close above the descending resistance line. The breakout occurred around the $0.0000060 area - a level that had previously acted as a pivot multiple times. Holding above it now becomes essential, as this is the first real attempt to convert former resistance into support.
The breakout coincided with a net outflow of approximately 133 billion SHIB from exchanges over 24 hours - a move often associated with accumulation and reduced sell-side pressure. That kind of coin removal from exchanges typically means holders are moving assets to cold storage rather than preparing to sell, which is consistent with the price behavior seen here. This also mirrors strong rebounds after liquidation events, where price reclaimed key levels amid rising volume.
Early Stabilization Signs - Not a Full SHIB Reversal Yet
Despite the breakout, the chart does not yet confirm a full bullish trend. The current picture is more accurately described as a structural disruption than a reversal. Price action shows:
- The downtrend structure has been broken but not fully reversed
- Candles are consolidating just above the former trendline
- Momentum remains limited, with no strong expansion in volatility
Selling pressure is clearly easing, but buyers are still in the process of establishing control. Sideways trading phases often precede breakout attempts - and the current consolidation directly above the broken trendline fits that pattern well.
The $0.0000059-$0.0000063 Range Now Defines the Next SHIB Move
The immediate question is whether SHIB can maintain acceptance above the breakout zone. The $0.0000059-$0.0000063 range has acted as a key decision area in recent sessions - holding above it has consistently signaled fading sell pressure, while slipping back below would risk turning this into another failed attempt within the broader downtrend.
A trendline break only means something if price can hold on the other side of it - that confirmation is what the next few sessions will need to provide.
If SHIB continues to stabilize above this range, the breakout holds its validity. Failure to hold, however, resets the structure back to bearish. For now, the pattern of consistent rejection is broken - and as history suggests, breaking a downtrend can signal renewed bullish momentum if follow-through confirms the move. The structure has shifted from clear downside control to a more neutral, watchful phase.
 Peter Smith


