 Usman Salis

⬤ Hyperliquid (HYPE) keeps printing fresh lows while it stays under a clear falling trendline. Each new low proves that sellers still rule the market. On the one hour chart the token lifts from its intraday bottom - yet the trendline turns back every upward try.
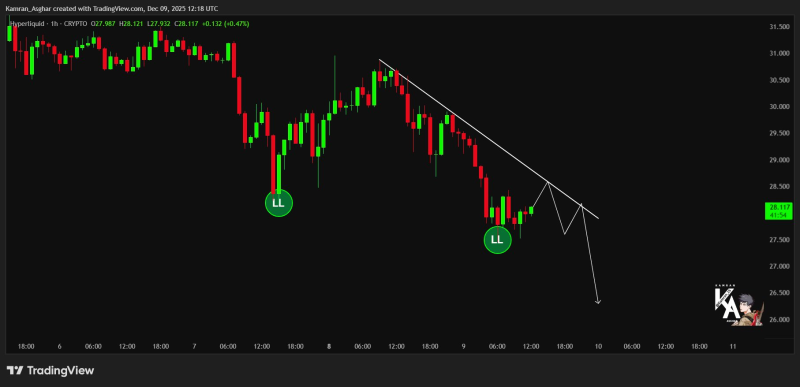
⬤ The chart displays a string of lower lows that confirm the bearish trend remains intact. After a steep drop early this week the price steadied near twenty seven to twenty eight dollars, but momentum faded and another low followed. The descending line that links recent swing highs shows sellers strike each minor rally and force the price downward. The picture implies the line will be tested again before any further slide.
⬤ Momentum stays feeble across the timeframe - HYPE trades under key intraday levels and shows almost no bullish force that would snap the downtrend. The chart sketches a rejection case in which each rebound attempt ends in a new low. Price hovering in the upper twenty-seven-dollar area illustrates how closely the token crawls beneath this barrier.
⬤ This formation carries weight because a descending structure with repeated lower lows signals steady downward pressure unless the trendline breaks in convincing fashion. For HYPE, the way price behaves at this resistance will steer short term mood and near-term volatility. If the line keeps turning back recovery moves, further weakness should follow while the bearish pattern extends.
 Usman Salis


