 Usman Salis

⬤ HYPER just confirmed a breakout from the descending channel that's been holding it down for months. The daily chart shows a strong bullish push above the upper trendline, with price now sitting around $0.15. This is the first real break from the pattern that's defined HYPER's downtrend since mid-2025.
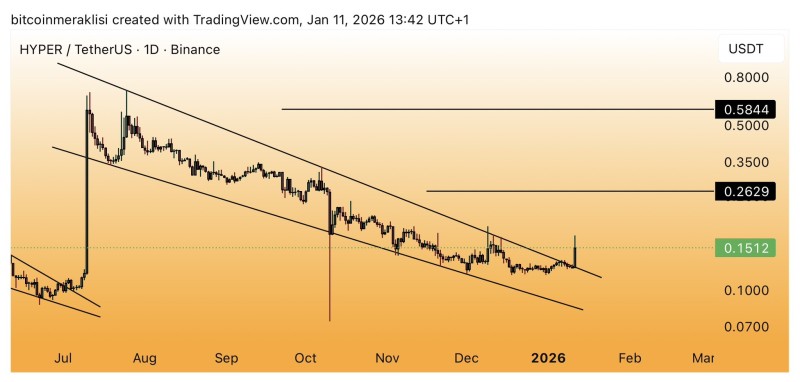
⬤ Before this move, HYPER was stuck in a falling channel with lower highs and lower lows grinding it down. The chart shows repeated rejections at descending resistance—until now. This breakout marks the first decisive close above that channel, suggesting the short-term structure might be shifting.
⬤ The next level traders are watching is $0.26. That's where HYPER consolidated before, and it's now the primary upside target if this momentum keeps going. There's no guarantee of a straight shot higher, but $0.26 is the zone to watch as long as price stays above the broken trendline.
⬤ Why this matters: breakouts from long downtrend channels often signal a real shift in momentum. The key now is whether HYPER can hold above the former resistance. If it does, this could develop into something bigger. If not, we might see consolidation instead. Either way, the breakout level and $0.26 target give traders a clear framework for what comes next.
 Usman Salis


