 Usman Salis

⬤ HYPE has stayed firmly above its support zone after a strong rally from the low $20s to above $30. Despite pulling back from recent highs, the token hasn't broken through key support levels. The current pullback is being viewed as wave (4) potentially forming a local top, though the underlying support structure remains solid.
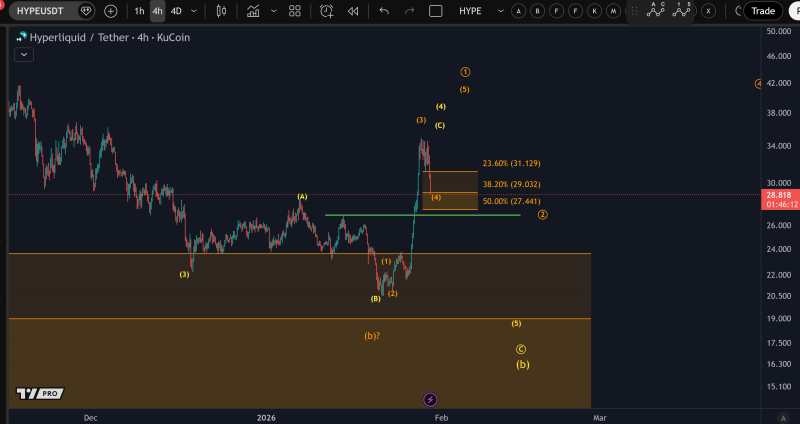
⬤ Chart analysis reveals a powerful upward move followed by a retracement into Fibonacci territory. Price is now consolidating between the 23.6% and 50% retracement levels—roughly $27.40 to $31.10—an area that previously acted as resistance before flipping to support. This consolidation pattern suggests the pullback is corrective rather than signaling a trend reversal.
⬤ Elliott Wave analysis shows the recent upward movement completed an impulsive sequence, with the current decline marked as wave (4). HYPE continues trading above the green support line that capped price action before the breakout, and this level has held firm as a floor, confirming the broader bullish structure hasn't collapsed.
⬤ This price action matters because HYPE has demonstrated strong momentum and significant volatility in a compressed timeframe. The token's ability to defend support during consolidation could shape short-term sentiment and determine whether continuation or deeper retracement follows. How price reacts at these established support zones typically influences near-term direction and trader confidence.
 Usman Salis


