 Saad Ullah

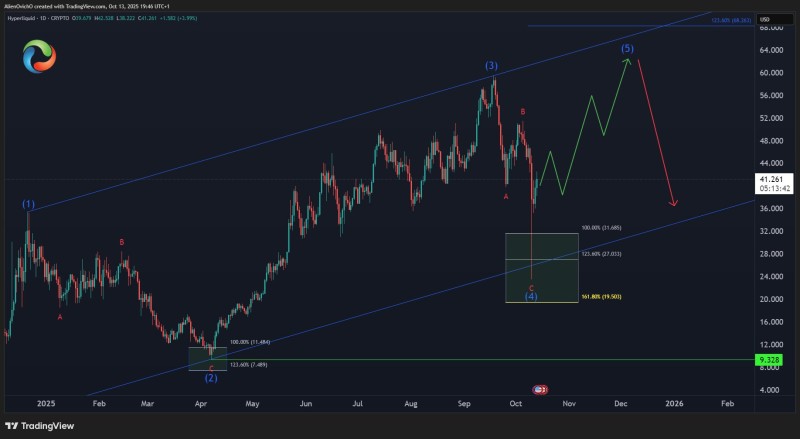
After weeks of choppy price action, Hyperliquid ($HYPE) might be gearing up for one more bullish leg. If this analysis holds, wave (4) has likely bottomed out, opening the door for a wave (5) rally into the $60–$68 zone before the market takes a breather with a deeper correction.
Chart Analysis: Elliott Wave Outlook
Trader AlienOvichO recently pointed out that the token's latest drop followed a textbook three-wave correction pattern. The chart shows a clear Elliott Wave pattern unfolding: wave (1) kicked off the bullish trend, wave (2) retraced deeply to around $11–$7.50, and wave (3) surged to a peak near $63–$65. The recent wave (4) played out as a classic A–B–C correction, finding support between $27–$32, though there's an outside chance it could dip to $19.50. Assuming this correction is done, wave (5) could now be taking shape with upside targets in the $60–$68 range, which lines up with Fibonacci extensions and the upper edge of the rising channel.
Key Levels to Watch
- Support: $27–$32 is the critical zone confirming wave (4) has finished; a drop below $19.50 would break the bullish structure
- Resistance: Near-term hurdle at $44–$48, with the main target sitting at $60–$68 for wave (5)
Market Context
Hyperliquid has been picking up steam in the decentralized perpetuals space lately, with growing liquidity and stronger user engagement backing the bullish case. That said, the broader crypto market mood and Bitcoin's direction will ultimately determine whether $HYPE can hit that $60–$68 target.
Technically, Hyperliquid looks poised for one final upward push toward $60–$68 before a more significant correction kicks in. Keeping an eye on the $27–$32 support zone is crucial—holding there would confirm the bullish Elliott Wave count and keep the rally alive.
 Saad Ullah


