 Saad Ullah

While Ethereum has been pulling back recently, something interesting is happening beneath the surface. The weekly chart is showing a classic hidden bullish divergence - one of those rare technical patterns that often catches traders off guard right before major moves up.
Key Technical Details
According to crypto analyst Crypto Rover, ETH managed to hold a higher low on the price chart, but the RSI momentum indicator made a lower low during the same period. This disconnect is actually bullish because it suggests buyers are quietly accumulating even though the momentum looks weak on paper.
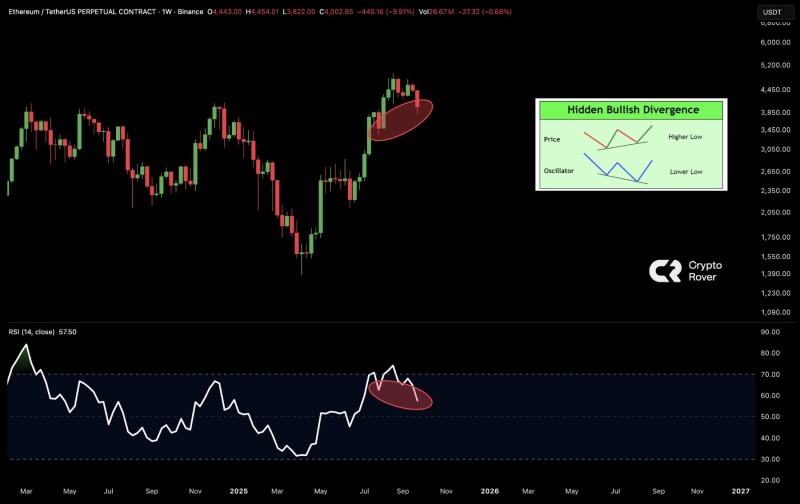
- Pattern Type: Hidden bullish divergence on weekly timeframe
- Price Action: Higher lows maintained despite recent weakness
- RSI Behavior: Lower lows indicating potential momentum reset
- Upside Targets: $4,500 and $5,000 if the pattern confirms
Why This Pattern Matters
Historically, these divergence patterns have been reliable early warning signs for Ethereum rallies. The beauty of hidden bullish divergence is that it typically forms during healthy pullbacks within larger uptrends, which is exactly what we're seeing now.
The setup doesn't guarantee immediate upside, and short-term choppiness is still likely. But for anyone watching ETH's longer-term trajectory, this technical development significantly strengthens the bullish outlook for the coming weeks. Smart money often moves on these signals before the broader market catches on.
 Saad Ullah


