 Eseandre Mordi

⬤ Ethereum's hitting a make-or-break technical spot right now. ETH is trading above a key daily zone around $3,320 that just flipped from resistance to support, and it's bumping up against the 200-day EMA at the same time. The daily chart shows price hanging out in that blue-highlighted area after climbing back above it. This zone switching sides is significant because it suggests the recent selling pressure has backed off compared to when ETH dropped toward $2,716 earlier.
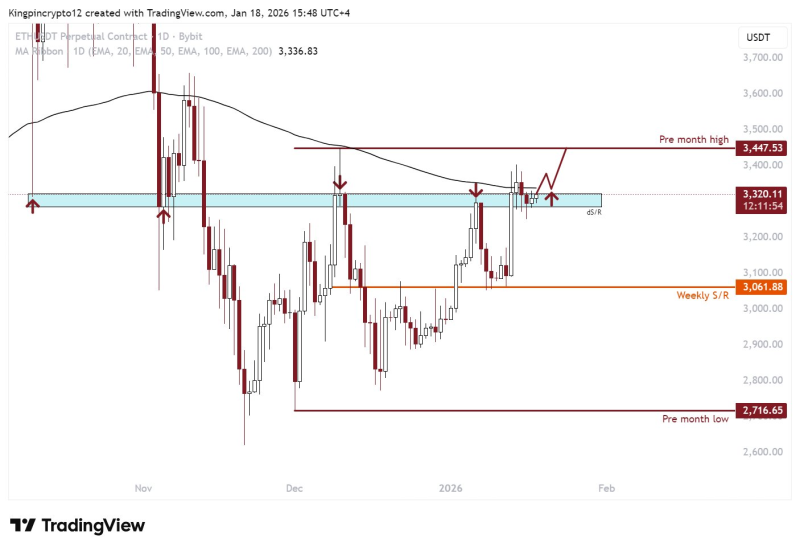
⬤ Right now ETH is stuck just below that 200-day EMA on the daily timeframe. The chart shows multiple rejections at this moving average, proving it's acting as solid overhead resistance for the moment. But the fact that Ethereum reclaimed that daily support zone is encouraging—it means bulls managed to defend a level that was previously keeping price down. The big question is whether they have enough juice to push through the 200-day EMA or if we're about to see another rejection.
⬤ If ETH does manage to flip that 200-day EMA and hold above it, the next upside target sits around $3,447—that's the pre-month high and lines up with the $3,450 area shown on the chart. That would be a pretty bullish development. On the flip side, if price gets rejected here and loses that $3,320 support zone, the next level to watch is the weekly support around $3,061. That's the closest solid floor below current price.
⬤ This setup matters because when daily support/resistance zones flip and price tests major moving averages at the same time, it often triggers the next significant move. For Ethereum specifically, getting accepted above the 200-day EMA would strengthen the recovery narrative and potentially open the door to higher prices. A rejection, though, would likely mean more sideways action stuck in this range. With ETH sandwiched between these key technical levels, how it reacts here will probably set the tone for where it's headed in the short term.
 Eseandre Mordi


