 Marina Lyubimova

⬤ Ethereum has fallen back into a long-term demand zone around $2,000 — and the market is now at a real crossroads. The weekly chart shows ETH pressing directly into support after months of underperforming Bitcoin. What happens here could define the next several weeks of price action for Ethereum.
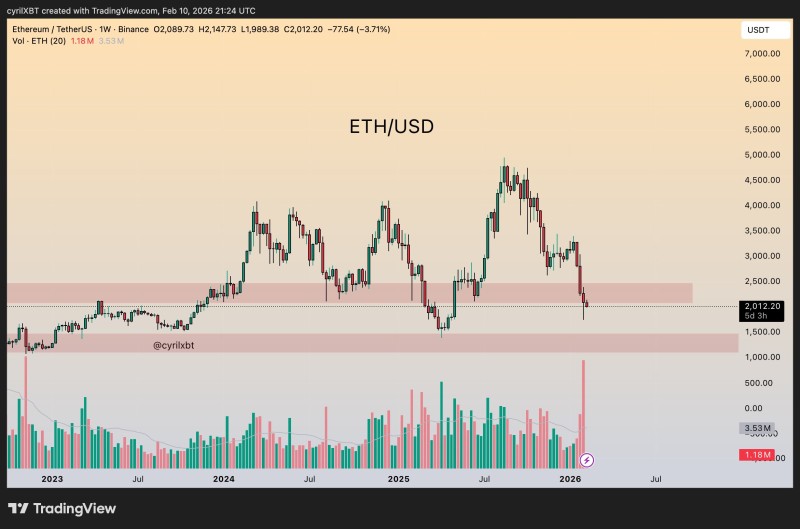
⬤ ETH/USD is currently hovering around $2,012, sitting right at the lower edge of its historical accumulation zone — a region that has triggered strong bounces in the past. If buyers step in and defend this level, a multi-week recovery move is on the table. That would fit the pattern outlined in Ethereum Signals Strength as Funding Rates Turn Negative, where support preservation often front-runs a recovery attempt.
⬤ But if this zone gives way, the next meaningful floor sits all the way down near $1,500. The weekly structure isn't encouraging — ETH is printing lower highs and losing momentum relative to BTC, both classic warning signs. History backs up the concern too, as ETH Price Cycles Show Ethereum Downtrends Can Last Up to 156 Days highlights how extended corrections have followed prior support failures.
⬤ This level carries outsized importance because it sits at the intersection of long-term market structure and a psychologically significant price. Hold it, and Ethereum stays range-bound with a recovery path still open. Lose it, and the broader trend flips decisively bearish — with ripple effects across short-term crypto market momentum.
 Marina Lyubimova


