Peter Smith

⬤ Ethereum's been compressing inside a symmetrical triangle on the 4-hour timeframe, showing how volatility has dropped as the asset nears a major turning point. The $2,900 level has turned into the main battleground near the tip of this pattern, with recent candles squeezing closer together along the converging trendlines.
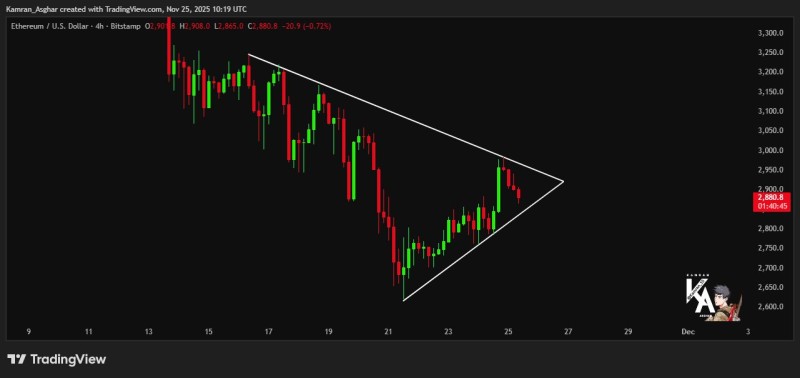
⬤ The chart displays a clean pattern of lower highs and higher lows since mid-November, building a contracting formation. ETH pulled back from the upper trendline and now sits around $2,880, showing how both bulls and bears are holding their ground. Price is pushing toward the triangle's apex, marking how tight this compression has become.
⬤ This consolidation typically means volatility's about to spike once Ethereum breaks through either trendline. The $2,900 zone stays central to where momentum heads next. The pattern's narrowing structure points to a decisive move coming once price gets squeezed out of this tight range.
⬤ These compression phases often come right before bigger sentiment shifts. How Ethereum behaves around $2,900 could set the tone for short-term direction across crypto markets, especially as traders watch whether this triangle breaks up or down.
 Peter Smith