 Artem Voloskovets

Ethereum traders are caught between two competing narratives right now. The long-term picture looks bullish, but short-term signals hint at one more drop before the real rally begins.
What the Chart Shows
Trader Crypto Tony, known for his Elliott Wave analysis, sees ETH still working through a correction phase. His latest chart shows a clean wave structure pointing to a final dip toward $3,200–$3,300 before a strong recovery kicks in. If he's right, this last pullback could be the best entry point before Ethereum's next major leg up.
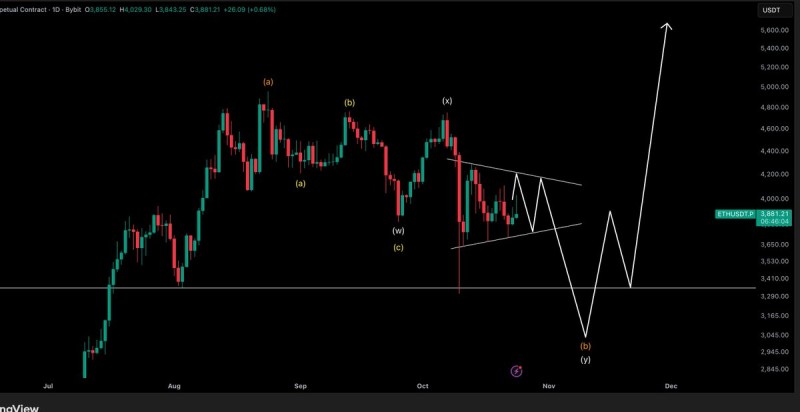
Ethereum is currently trading around $3,881, forming a descending wedge—a pattern that often precedes breakouts. The daily chart displays a textbook Elliott Wave correction with overlapping movements typical of consolidation within a larger bull market. The pattern isn't finished yet. Wave (y), the final piece, is projected to push slightly below $3,300 before reversing sharply. Once that low hits (marked as wave (b) in the analysis), the model forecasts a strong rally potentially reaching $5,000–$5,600 in the coming months. The price action inside the wedge looks corrective, which means any current long positions are best treated as short-term trades rather than long-term holds.
Why the Bigger Picture Stays Bullish
Despite near-term weakness, Ethereum's fundamentals remain solid. On-chain activity and staking numbers continue growing steadily. Speculation around a potential Ethereum ETF approval could bring significant buying pressure later this year. And Bitcoin's recent consolidation has historically set the stage for Ethereum's next move higher, suggesting the broader altcoin market may be gearing up for rotation.
These factors support the idea that current weakness is just a pause before the next expansion phase rather than anything more concerning.
Three zones matter most right now:
Resistance: $4,100–$4,200 — the upper edge of the wedge that needs to break for bulls to take control. Support: $3,200–$3,300 — where wave (b) should complete and the reversal potentially begins. Target: $5,000–$5,600 — the projected destination if the bullish wave structure plays out as expected.
These levels line up perfectly with the wave count, which shows a short-term drop followed by a steep climb.
Ethereum appears to be following a classic Elliott Wave correction, with one more downward leg likely before breaking out to new highs. If price bounces strongly from the $3,200 support zone as projected, the next rally could mark the beginning of Ethereum's next major bullish phase.
For now, treat any long positions as short-term scalps. But stay ready—once this correction finishes, Ethereum's move up could happen fast and forcefully.
 Artem Voloskovets


