Artem Voloskovets

⬤ Ethereum is holding steady above the $3,000 mark after briefly dipping below $3,050 and bouncing right back. The quick recovery shows this support zone is doing its job. On the daily chart, you can see price stabilizing after a sharp drop, with buyers jumping in at a well-defined horizontal support area.
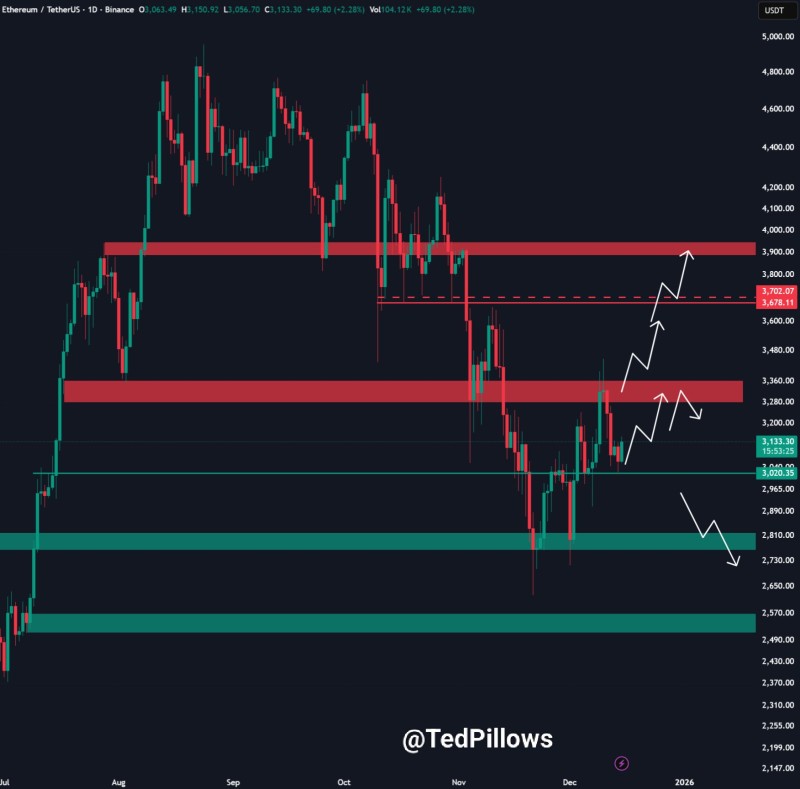
⬤ The chart shows a rebound attempt after the selloff pushed ETH down toward lower demand zones. After recovering from just above $3,000, Ethereum is now in consolidation mode while the market figures out if this support will stick. If it holds, the setup points to a potential move back into the $3,300 to $3,400 range—an area that previously acted as resistance during the earlier decline.
⬤ The chart also maps out the downside risk if Ethereum can't keep $3,000. A clean break below this level could trigger a faster drop toward the next major demand zone under $2,800. This lower area represents a strong support band where buyers have stepped in before. Right now, the setup shows a tug-of-war between recovery potential and downside pressure, all depending on how ETH behaves around the $3,000 pivot.
⬤ This matters for the broader crypto market because Ethereum is a major driver of overall sentiment. ETH staying above $3,000 keeps the short-term structure stable, while a breakdown could shake up volatility across digital assets. How Ethereum handles these technical levels will likely shape near-term direction and confidence as traders watch for either continuation or renewed weakness.
 Artem Voloskovets