 Eseandre Mordi

Ethereum is once again drawing attention as its long-term structure begins to resemble a prior cycle that led to a major rally. As Leshka.eth noted, the current chart setup mirrors the 2015-2018 period, when ETH transitioned from accumulation into a sharp expansion phase - raising the possibility of a similar structural shift unfolding now.
A ETH Cycle Pattern Repeating Across Time
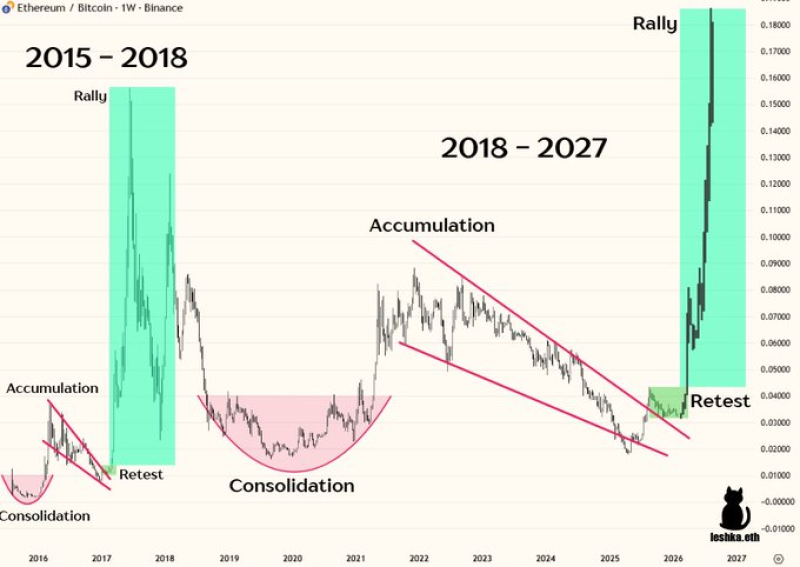
The chart explicitly compares two phases: the 2015-2018 cycle and the ongoing 2018-2027 structure. In the earlier period, Ethereum moved through accumulation, followed by a retest, and then a strong rally.
This sequence - accumulation, breakout, and retest - is visually consistent with the earlier cycle, though stretched over a longer timeframe.
The current structure shows a prolonged accumulation phase extending over several years, followed by a breakout from a descending trendline. Price is now positioned in a highlighted retest zone, suggesting the market is attempting to hold above former resistance.
The Break That Shifted ETH's Long-Term Structure
A key technical development is the break of the long-term descending channel that defined price action from 2021 through 2025. That channel showed a series of lower highs and lower lows, indicating sustained downward pressure. The recent move above this structure marks a potential shift:
- The descending resistance line has been broken
- Price is attempting to hold above that breakout level
- A retest zone has formed just above prior resistance
This is a classic transition point in technical analysis, where a market moves from a corrective phase into a potential new trend - provided the breakout holds. ETH Stalls Below $2,300 as Bearish Pressure Holds at Key Resistance captured the resistance dynamic playing out at a key level during this same transition phase, showing how Ethereum has been working through overhead supply on its way toward confirming the breakout.
Where the ETH Breakout Setup Becomes Conditional
The chart emphasizes that the current phase is not yet a confirmed rally - it is a transition. The highlighted green zone shows price stabilizing after the breakout rather than accelerating immediately.
A failure to hold above the former trendline would invalidate the breakout and return the structure to broader consolidation - the setup is possible, not guaranteed.
Ethereum Price Outlook: Bullish Path Points Toward $6,000 outlines what the expansion phase could look like if the retest holds successfully, while Ethereum Maps Cycle Path Toward $20K as Accumulation Zone Holds places the current setup within an even longer cycle framework - showing the more extended upside scenario that the 2015-2018 comparison implies if the structural parallel continues to play out.
The comparison to the previous cycle highlights what is possible, not what is guaranteed. For now, Ethereum is positioned at a structural pivot - no longer clearly in a downtrend, but not yet fully in a confirmed expansion phase. That confirmation depends entirely on whether price can maintain its position above the former trendline in the sessions ahead.
 Eseandre Mordi


