Saad Ullah

Dogecoin (DOGE) is trying to find its footing after weeks of selling pressure, with price action clustering tightly around the $0.16 mark. This zone lines up with an important RSI retest on the daily timeframe, where the momentum indicator is touching a descending trendline that's been guiding the downtrend for months. It's a setup worth watching for anyone tracking signs that the current slide might be losing steam.
Price Action Aligns With Momentum Retest
Since early October, DOGE has been printing lower highs and lower lows, confirming sustained selling before finding some temporary support between $0.155 and $0.165. The chart shows the asset attempting to consolidate in this range after an extended decline.
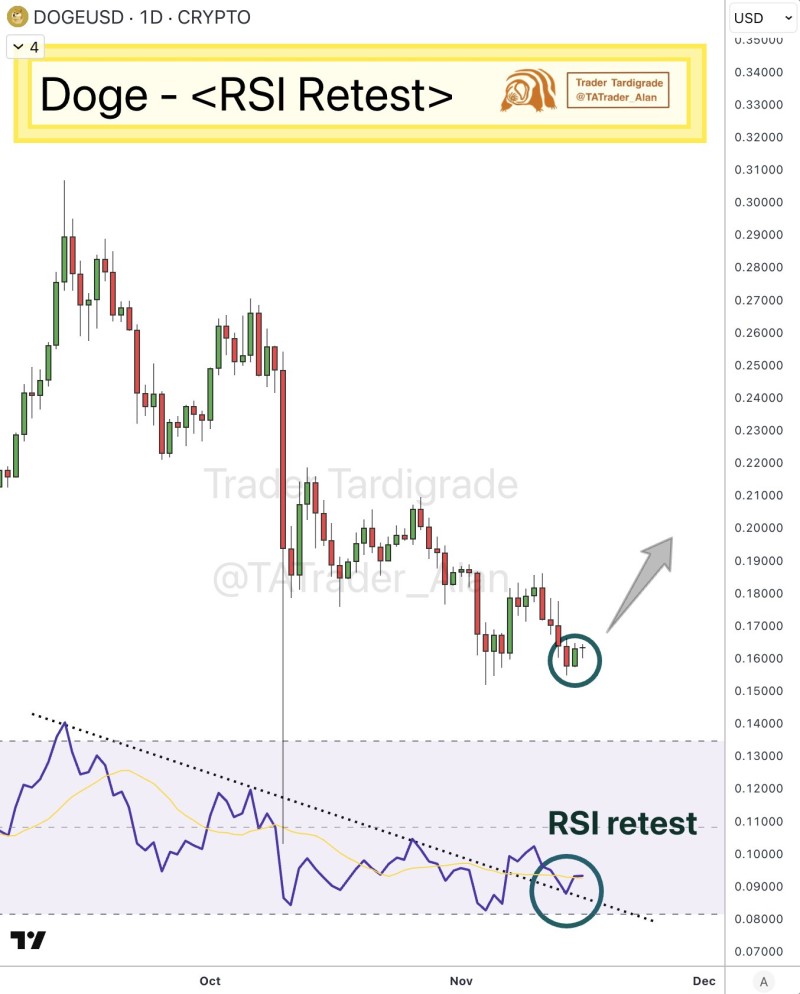
What makes this moment interesting is what's happening with the RSI below. The indicator is touching that dotted downward trendline and showing a reaction right at this level. These kinds of retests often mark inflection points where momentum can start shifting, even before price makes its next move clear.
Technical Context Points to a Potential Pause in Bearish Momentum
While there's no confirmed reversal yet, a few technical pieces are starting to align:
- DOGE is trading above minor support around $0.155
- The RSI retest shows bearish momentum is slowing down
- A potential recovery scenario exists if buying interest picks up
These signals don't guarantee a bounce, but they do show that selling pressure isn't accelerating anymore.
Final Thoughts
Dogecoin's current structure and RSI behavior suggest things are reaching a moment of balance after weeks of decline. The RSI retest adds some technical weight to the idea that we might see short-term stabilization or even a modest recovery attempt if buyers step back in. The question now is whether DOGE can hold this $0.155–$0.165 range and build momentum above the retest level as November continues.
 Saad Ullah