 Peter Smith

⬤ A recent Elliott Wave analysis suggests Cardano (ADA) is following a pattern that's completely different from other major cryptocurrencies. Every internal wave has been carefully mapped out, and the conclusion is striking: there's serious potential for astronomical price levels in the years ahead—but only if ADA holds a critical red line on the chart. If that support breaks, the bullish case falls apart.
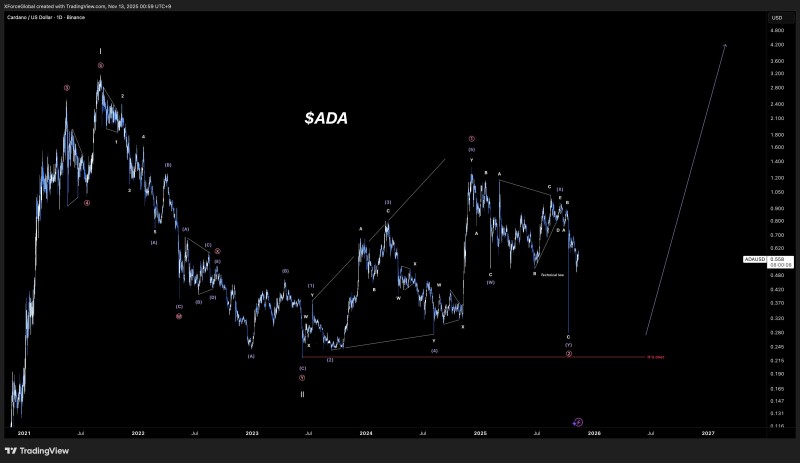
⬤ The daily chart shows a multi-year wave sequence stretching back to 2021, with ADA now sitting on its 4-year support line around $0.24–$0.26. This level is marked as "It's over"—meaning a break below would invalidate the bullish structure and signal more downside. But if it holds, ADA may have completed a major corrective phase (Wave II) and could be gearing up for a powerful Wave III expansion that sends the price to new all-time highs.
⬤ The bullish outlook hinges entirely on ADA staying above that red line. A breakdown would confirm the correction isn't finished and likely trigger further selling. For long-term holders and traders watching Cardano's technical structure, this is a make-or-break zone—and the stakes couldn't be higher.
⬤ What makes this analysis stand out is the claim that ADA's price behavior is decoupling from the broader crypto market. The wave count shows deep structural symmetry and a long accumulation phase—patterns that often come before major reversals. If the technical base holds, Cardano's next rally could be huge.
⬤ ADA is trading near $0.58, consolidating within its range. Staying above $0.25 would validate the bullish scenario and could kick off Cardano's next big move, potentially positioning it as one of the strongest comeback stories in crypto.
 Peter Smith


