 Usman Salis

Cardano (ADA), one of the top altcoins by market capitalization, has been under pressure in recent months, with its price trending steadily downward since early 2025. According to a chart shared by well-known trader Ali (@ali_charts), ADA may be nearing a crucial turning point as it tests the lower boundary of its multi-month descending channel.
ADA Faces the Bottom of a Descending Channel
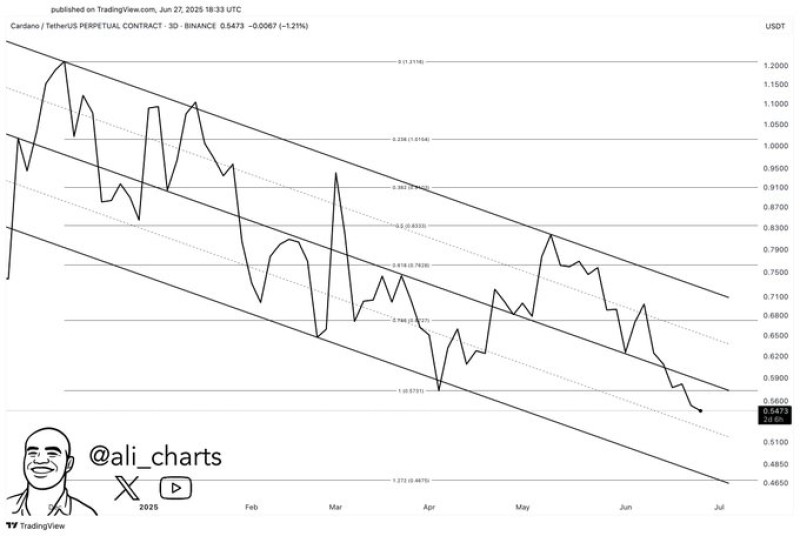
Currently trading at $0.6473, Cardano has followed a consistent bearish trajectory inside a parallel channel that began forming earlier this year. The technical chart illustrates key Fibonacci retracement levels, with the 0.618 and 0.786 zones already breached. The next critical area to watch is the 1.618 Fibonacci extension, aligning closely with the $0.4711 level — a potential inflection point.
Historically, price action near the bottom of such channels often indicates either a strong bounce or an imminent breakdown. Volume remains low, and momentum indicators such as RSI hover in oversold territory, supporting the case for a relief rally.
$0.47 Could Be a Make-or-Break Zone
As noted in the trader’s analysis, the $0.47 support level may serve as a psychological and technical floor. If ADA holds this line, a reversal could push the price back toward resistance levels near $0.70–$0.75, offering traders a possible 30% upside.
However, if support fails and bears take control, the next major support lies near the $0.41–$0.43 range, potentially putting further pressure on Cardano holders. The upcoming weekly close will be critical in determining whether ADA can stabilize or break down further.
Conclusion
All eyes are now on Cardano’s reaction at the $0.47 support zone. A bounce from this level could attract renewed buying interest and reverse the downtrend, while a breakdown might accelerate the decline toward new lows. As always, traders should monitor volume, RSI, and breakout signals closely.
 Usman Salis


