 Saad Ullah

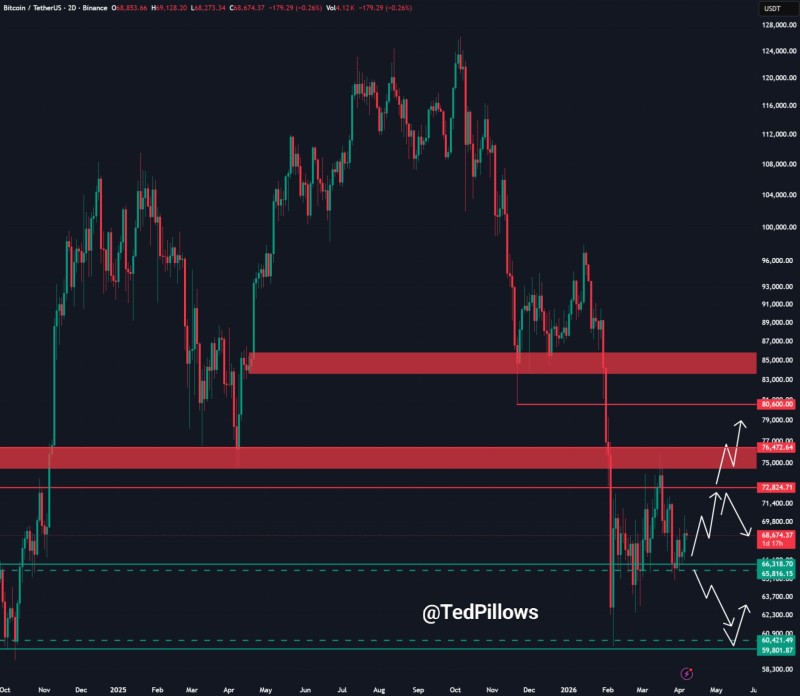
Bitcoin's latest bounce has stalled once again at a critical resistance band, reinforcing a pattern of failed recoveries. Crypto analyst Ted, pointed out that BTC tapped the $69,000-$70,000 resistance zone and was firmly rejected - confirming it as a key ceiling. While buyers continue to step in at lower levels, the broader structure still points to a market struggling to regain strength after a sharp breakdown.
BTC tapped the $69,000-$70,000 resistance zone and was rejected, confirming it as a key barrier. This zone has consistently attracted sellers on every approach.
The BTC Rejection That Confirms the $70K Ceiling
This behavior is clearly visible in the chart, where price rallies into the zone are consistently met with selling pressure. The level aligns with a broader technical ceiling that has capped upside attempts ever since the breakdown. Recent market coverage reinforces this dynamic - analysts have noted that Bitcoin falls below $68K as reclaiming $70K becomes critical, with the level having flipped from support into resistance and shifting short-term momentum lower.
A Bitcoin Breakdown That Reshaped the Trend
The chart shows a decisive move lower from elevated levels, followed by a failed recovery attempt. That sequence has established a structure of lower highs, with each rally struggling to break through overhead supply.
Each failed attempt to reclaim resistance adds another lower high to the sequence. The structure is not ambiguous - sellers remain in control above $69K.
This aligns with broader BTC technical analysis, where rejection below key resistance levels tends to keep the market locked in corrective phases rather than signaling a genuine trend reversal. Price is now trading below previously held zones, confirming that prior support has turned into resistance - a classic shift in market structure. More detail on this dynamic is covered in the analysis of how BTC price structure confirms $70,900 resistance after breakdown.
Demand Holds, But BTC Structure Remains Fragile
Despite the rejection, buyers are still active. The chart highlights repeated reactions in the mid-$60K range, suggesting that spot demand continues to absorb selling pressure. This behavior mirrors recent observations where Bitcoin price holds $66K support while testing $68K resistance, creating a range-bound environment with no clear directional bias. The result is a temporary balance:
- Resistance firmly established at $69K-$70K
- Demand visible in the $60K-$66K region
- Price oscillating between these zones
However, this balance does not yet indicate strength - it reflects consolidation under resistance, not accumulation ahead of a breakout.
The BTC Pattern Pointing Toward Lower Lows
The defining feature of the current setup is the inability to reclaim resistance. Each failed attempt reinforces the broader downtrend, keeping sustained pressure on price.
Short-term bounces may continue, but without a clean break above $70K, each recovery attempt simply adds fuel for the next leg lower.
Potential continuation scenarios include further downside exploration if resistance continues to hold. Short-term upside moves may occur but lack durability. As long as BTC remains below the $69K-$70K zone, the structure favors continuation of the current downtrend rather than a meaningful recovery.
 Saad Ullah


