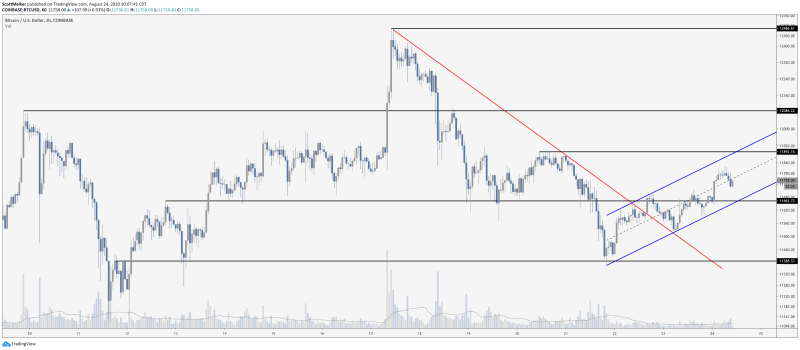
The price of Bitcoin (BTC) rose for about $300 from $11,400 after a strong breakthrough above $11,700. In recent months, the price has been in a narrow range and now the Bitcoin price will take off after years of resistance have passed.
A crypt trader with a Twitter nickname of The Wolf Of All Streets, reports that Bitcoin is surpassing important price levels and preparing to move up. According to him, the asset forms an upward channel that can be traded.
$BTCLow time frame levels and patterns.Clean breakout from downtrend (red) and retest. Blue ascending channel - don't want to see that break down.Horizontal areas (not exact lines) shown.Play it line to line if you are scalping. The Wolf Of All Streets @scottmelker via Twitter
As the one-hour chart suggests, the latest rally in Bitcoin is higher than the long-running rise of 2017, which grew to more than $11,600 and was driven by high volume spikes.
Typically, RSI and MACD indicators are overbought and sell signals, but Bitcoin's price history over the years shows that these two fluctuations can remain highly exaggerated as prices rise to new highs.

Bitcoin had recovered by almost 20% since July 21st, and after the top update, the price of Bitcoin rolled back, the indicators came out of the overbought zones.
Traders will monitor the trading volume on smaller timeframes, as a sharp drop in the buying volume may lead to a second check of $11,000.
 Alex Dudov

 Alex Dudov


