 Usman Salis

Bitcoin's price action has become remarkably predictable in one specific way: it keeps bottoming out in early October. This pattern has now played out three years in a row, and traders are taking notice. With the latest October low seemingly in place around $95,000–$100,000, many are asking whether history will repeat itself once more — and if so, just how high Bitcoin could climb by year's end.
Bitcoin Repeats Its October Cycle — Eyes Set on a Massive Q4 Rally
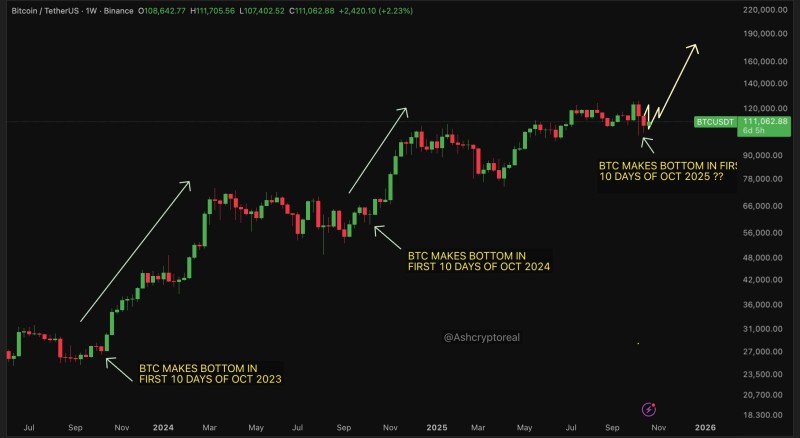
For three consecutive years now, Bitcoin has been following what looks like a seasonal rhythm: it hits a local bottom during the first 10 days of October, then rallies hard into the end of the year. Trader Ash Crypto recently highlighted this pattern, pointing out the striking similarities in market structure between 2023, 2024, and 2025. Each time, the timing has been almost identical — early October lows followed by strong upward momentum.
This recurring behavior has analysts wondering if Bitcoin's current position around $111,000 might be setting up for another explosive move. Some projections suggest the leading cryptocurrency could push toward $150,000–$180,000 before 2025 wraps up.
Looking at the weekly BTC/USDT chart from Binance, you can see the pattern pretty clearly. In October 2023, Bitcoin found support near $26,000 and then doubled in value over the next few months. Fast forward to October 2024, and BTC bottomed around $48,000 before surging past $90,000. Now in October 2025, we're seeing another local low form near $95,000–$100,000, with Bitcoin already bouncing back to $111,000. It's like clockwork.
What's interesting is that these reversals all happened within the first 10 days of October. It's starting to look like this month has become a regular accumulation window for bigger players and long-term holders. The chart also shows ascending arrows marking these post-October rallies, with the latest one pointing toward a potential breakout above $150,000 in Q4. The overall structure looks healthy — Bitcoin keeps making higher lows and higher highs on the weekly timeframe, which is textbook bullish momentum.
Key Technical Levels: Support, Resistance, and Momentum
Right now, Bitcoin is sitting above the $100,000 psychological level, which used to act as a key pivot zone earlier in the cycle. The next hurdle is around $120,000–$125,000. If Bitcoin closes a weekly candle above that range, it would likely confirm the start of a new leg up toward the $150K region. The support zone sits at $95,000–$100,000 where the recent bottom formed, resistance is at $120,000–$125,000, and the next target based on historical patterns is somewhere between $150,000 and $180,000 by Q4.
The upward slope of those arrows on the chart reinforces the bullish outlook. The fact that this pattern has held for three straight years makes it harder to dismiss as coincidence. It's starting to look like part of Bitcoin's actual market cycle rhythm.
The technical picture is one thing, but the broader market backdrop is supportive too. The U.S. Federal Reserve is expected to pause or even cut interest rates in 2025, which has historically been good for risk assets like Bitcoin. Meanwhile, Bitcoin spot ETFs keep pulling in record inflows, which means more institutional money is getting involved. On top of that, regulatory clarity around digital assets is improving globally, which tends to bring more investors into the space.
All of these macro and structural factors line up with Bitcoin's cyclical behavior. Liquidity tends to flow in and investor confidence tends to spike during the final quarter of major bull cycles. That's exactly where we might be headed now.
 Usman Salis


