 Usman Salis

⬤ ADA is currently trading in the $0.295-$0.300 range, pushing directly into a descending trendline that has been capping gains for some time. This resistance structure is clearly visible on the 4-hour chart and has repeatedly rejected upside attempts. It's the kind of setup that echoes earlier analysis covered in Cardano (ADA) price prediction and breakout structures, where descending resistance lines played a pivotal role in determining which way the trend would continue.
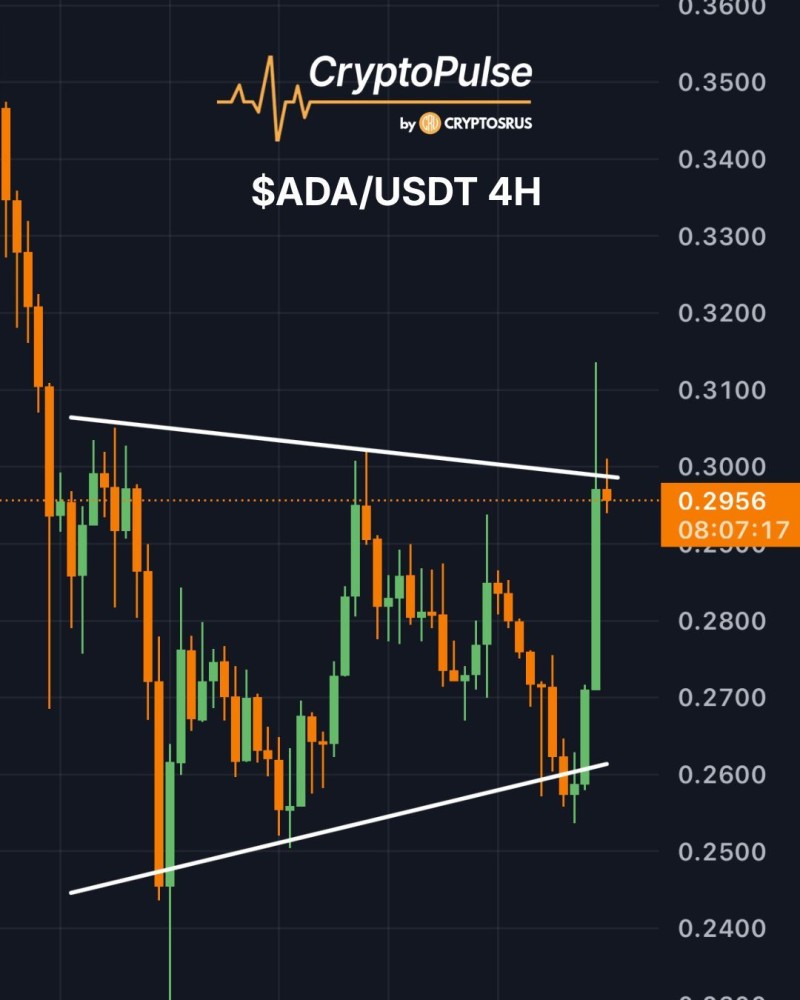
⬤ The chart tells a familiar story - a series of lower highs, a trendline connecting them, and price bouncing back up to test that ceiling again. The catch is that a brief spike above the trendline didn't hold. Price failed to close convincingly above it, which means sellers are still doing their job. This mirrors the pattern explored in the Cardano holding pattern below key breakout level analysis - until you get sustained closes above resistance, the structure hasn't really changed.
⬤ If bulls manage to push through and close above $0.30 with conviction, the next levels to watch sit in the $0.32-$0.34 zone - previous reaction areas that would likely attract both profit-taking and fresh resistance. That broader path upward has been mapped out in Cardano (ADA) price forecast toward $1 scenarios, where breakout confirmation was the critical first step.
⬤ Right now, ADA is at a decision point. The 4-hour chart is compressed, momentum has recovered from the lows, and the trendline is right there. A clean break changes the short-term picture. A rejection keeps ADA locked inside the same consolidation range it's been stuck in. The next few candles matter.
 Usman Salis


