 Usman Salis
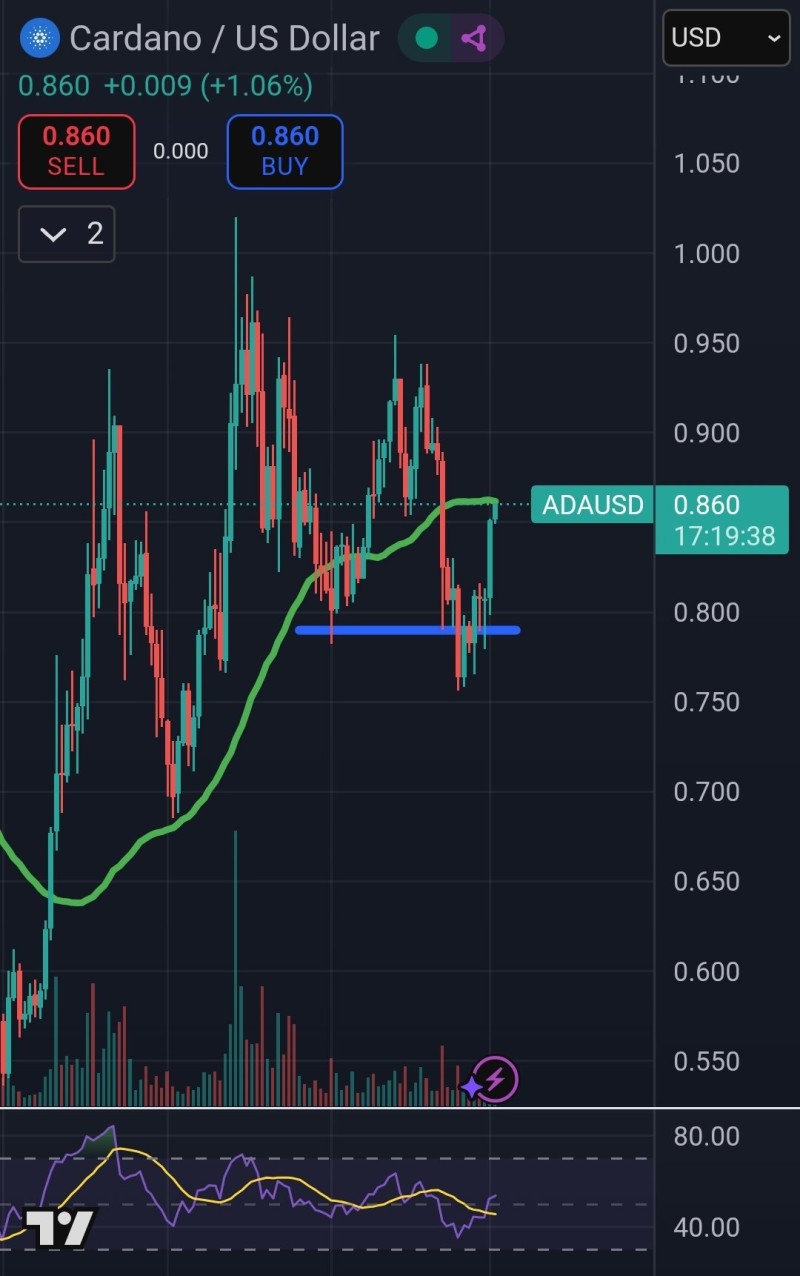
Cardano is showing real signs of strength after bouncing hard from the $0.78–$0.80 support zone. The price has clawed its way back up and is now sitting right at the 50-day moving average near $0.86. This isn't just another resistance level—it's the line in the sand that could determine whether ADA pushes toward $1 or falls back into consolidation. Bulls defended the low-$0.80s like their lives depended on it, and now the question is whether they've got enough firepower to break through.
What the Chart Is Telling Us
In a recent tweet, trader Sssebi highlighted, right now, ADA is staring down resistance at $0.86, which lines up perfectly with the 50-day MA. That green line on the chart has been a tough nut to crack. Below that, the $0.78–$0.80 zone has proven itself as solid support—buyers stepped in aggressively there and haven't looked back. If bulls can punch through $0.86, the path opens up toward $0.90–$0.92 pretty quickly, with $1.00 becoming a realistic target if momentum really kicks in. Volume's picking up, not explosively but enough to show interest is returning. RSI climbed out of oversold territory and is sitting comfortably in neutral ground, which means there's room to run without being overbought yet.
Why This Matters Now
The broader crypto market is starting to feel a bit better, and Cardano's catching that wave. Technical traders are glued to the 50-day moving average because it's one of those levels that tends to separate the bulls from the bears. Break above it and sentiment shifts fast. Get rejected and doubt creeps back in.
If ADA closes decisively above $0.86, we're likely looking at a rally into the $0.90s with $1.00 as the next psychological magnet. But if resistance holds firm here, expect another test of that $0.80 support, and if that breaks, things could get messy fast. Cardano's at a fork in the road, and the next few sessions will tell us which way this thing's headed for October.
 Usman Salis


