 Saad Ullah
⬤ Cardano (ADA) is back in familiar technical territory. The daily RSI has reset to the same zone it hit last July—right before ADA surged 97% over 54 days. The chart shows both the July reset and the current one circled, highlighting how similar the momentum conditions look right now. For traders who remember that summer rally, this feels like déjà vu.

⬤ Of course, technical setups don't guarantee anything. If buyers don't step in to support the pattern, momentum could stall, liquidity could dry up, and confidence could fade. A failed breakout—especially in a weak market—can trigger extended selling pressure and amplify volatility. The risk is real if this setup doesn't follow through.
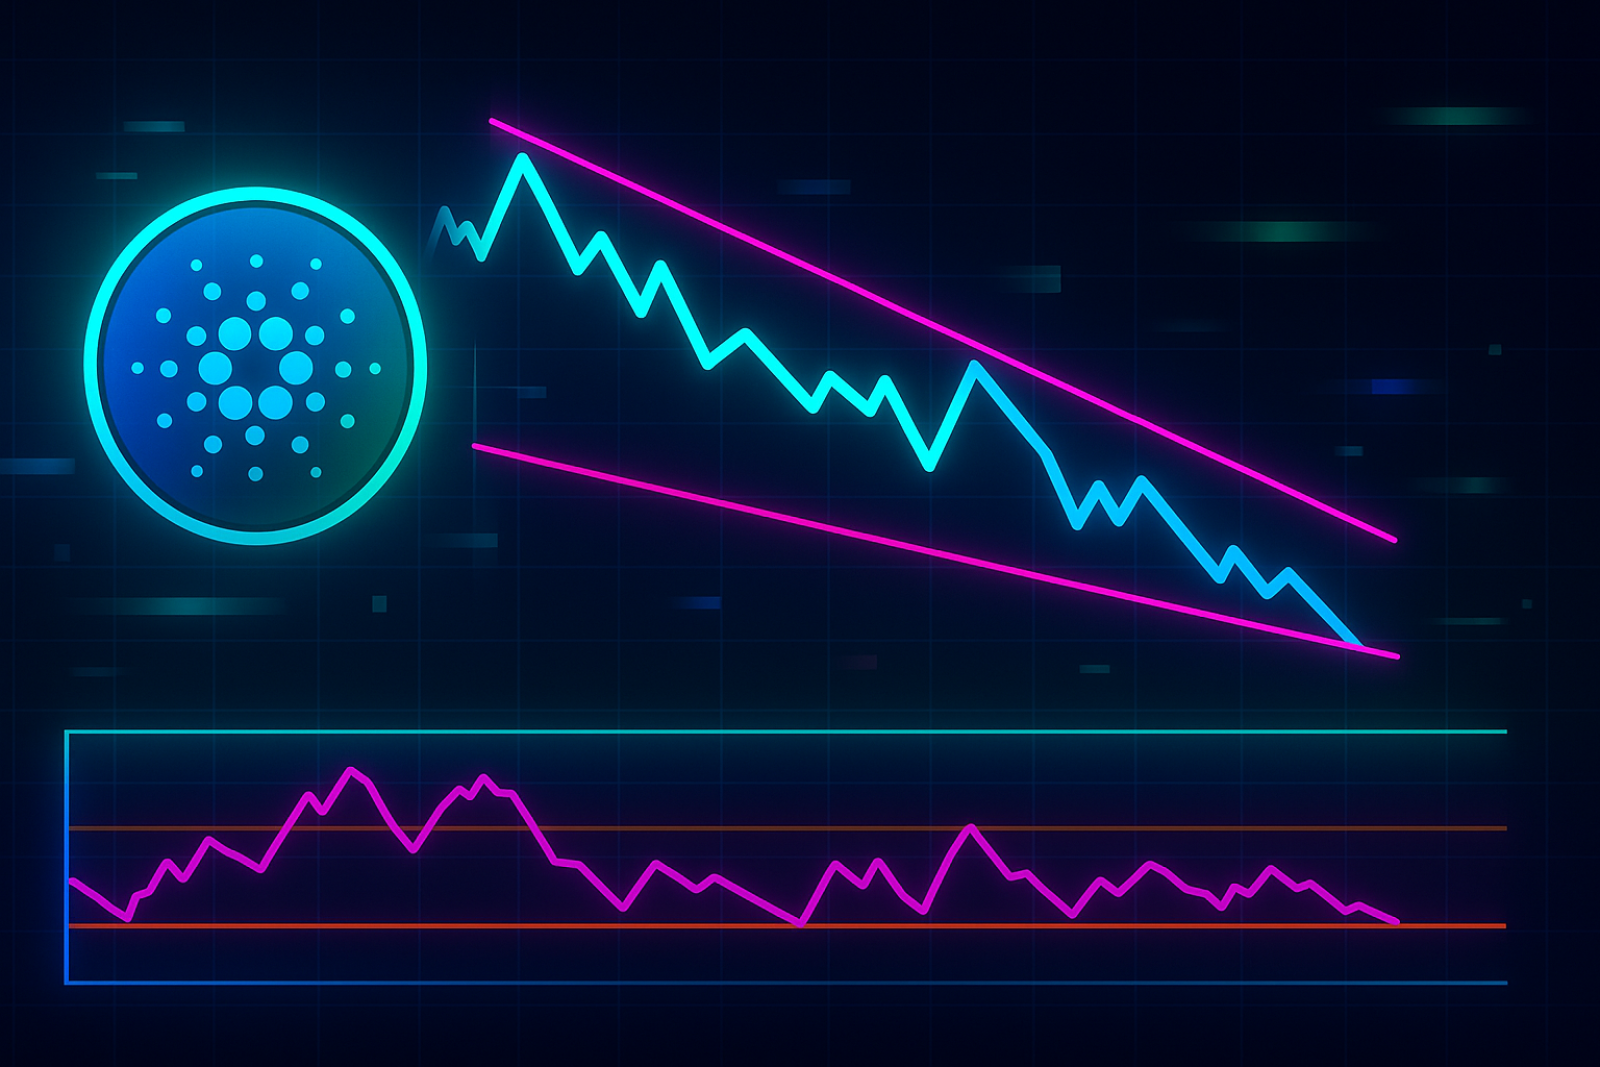
⬤ The chart also shows a falling wedge pattern forming, with converging descending trendlines that typically signal a potential bullish reversal. The RSI panel below mirrors the earlier reset almost perfectly, suggesting conditions might again favor upside momentum if a breakout materializes. It's setting up nicely—but it still needs confirmation.
⬤ For now, all eyes are on whether ADA can break above the upper trendline of the wedge. If it does, that would strengthen the case for renewed upside. If it fails, expect more consolidation or even further downside. The pattern is there, the history is there—but the breakout still has to happen.
 Saad Ullah


