 Usman Salis

Cardano's found itself at an interesting technical juncture. With quiet momentum building beneath the surface, traders are wondering: could we be looking at another breakout that kicks off a fresh leg up?
What the Chart's Telling Us
Crypto analyst Sssebi recently pointed out that ADA's sitting above its 50-week moving average, the same setup that preceded its last push to $1.
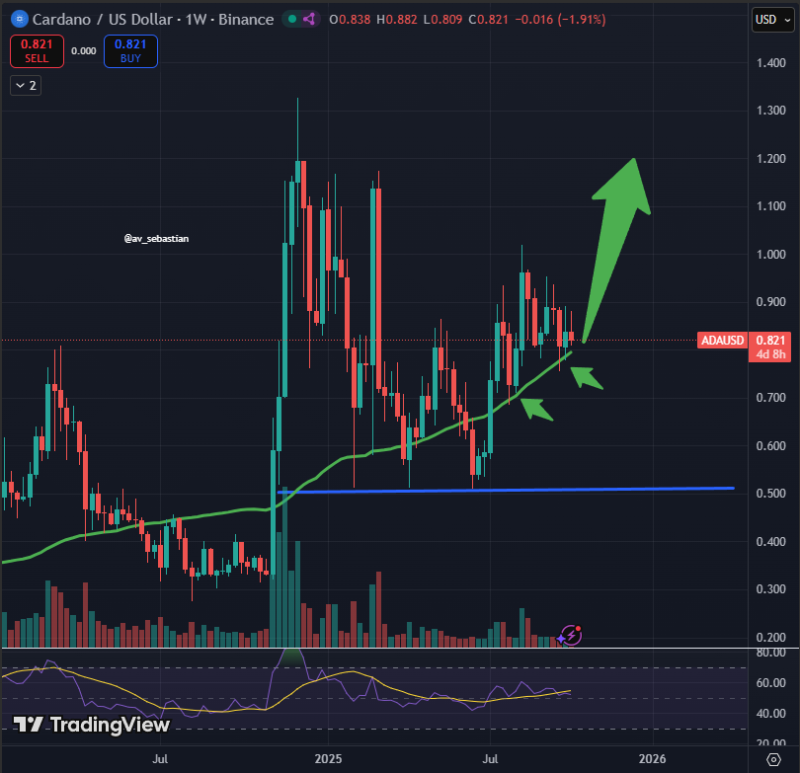
Looking at the weekly ADA/USDT chart, a few things stand out:
- Solid footing: ADA's trading around $0.82, comfortably above that 50-week MA (the green line), which has worked as a launchpad before
- Building pressure: The price keeps making higher lows and consolidating—classic signs that buyers are accumulating
- Next hurdle: There's resistance sitting between $0.90 and $1.00. Push through $1, and $1.20 starts looking realistic based on the chart's projection
- Safety nets below: If things cool off, there's support around $0.70, with another cushion down at $0.50
- RSI's neutral: The momentum indicator isn't flashing overbought, meaning there's headroom for a move up
Why This Could Actually Happen
The technicals aren't operating in a vacuum. ADA's held this moving average before—and last time, it worked. Meanwhile, altcoins are catching a bid as Bitcoin takes a breather, which tends to lift sentiment across the board. Add in Cardano's steady ecosystem development—new DeFi projects, network improvements—and there's substance backing the price action.
Cardano's parked at a spot that matters. Holding above the 50-week MA mirrors what happened before its last run to $1. If buyers can crack through that dollar mark, we could see ADA accelerate toward $1.20 and higher—potentially marking the beginning of a bigger uptrend. Worth keeping on the radar.
 Usman Salis


