Alex Dudov

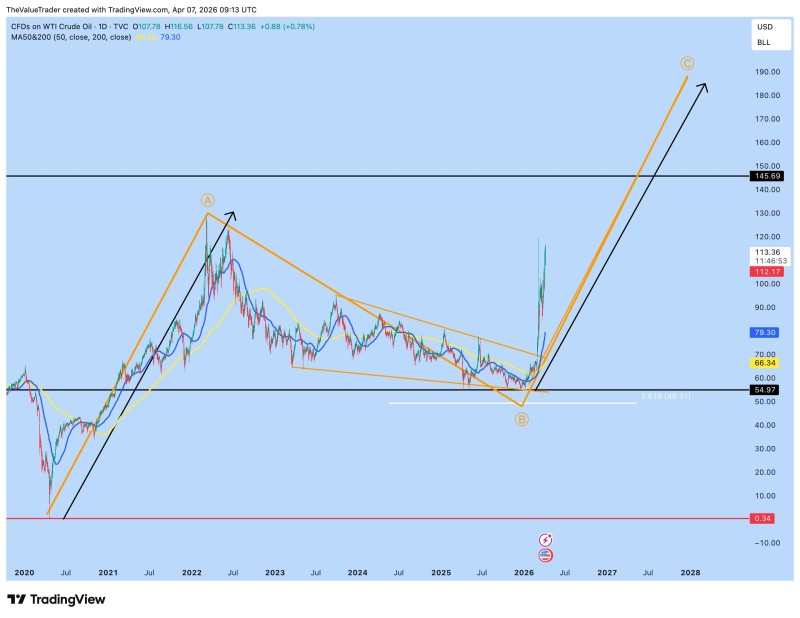
Oil is staging a powerful recovery from its multi-year base, with price surging from the $50-$55 zone toward triple digits. According to analyst The Value Trader, the current setup points toward a much larger upside scenario, with $180 emerging as a credible long-term target if momentum holds.
The chart outlines a broad corrective pattern, with a peak near the $120-$130 region (wave A), followed by an extended decline into the $50-$55 zone (wave B). That lower region acted as a clear support base, where price stabilized before reversing higher.
The reaction zone near $55 marks a structural floor. From there, price began accelerating upward, signaling a shift away from the prior downtrend.
USOIL Momentum Reclaims Key Moving Averages
The recovery from the $50 area has been sharp and decisive. Price has pushed above both the 50-day and 200-day moving averages, sitting near $66 and $79 respectively. Moving averages that previously acted as resistance are now being reclaimed, reinforcing the idea that the broader structure is shifting in favor of buyers.
The current move also aligns with broader oil market behavior, where WTI crude oil surges above $84 with strong momentum during ongoing bullish phases - a pattern consistent with the developing structure on USOIL.
Moving averages that previously capped price action are now flipping into support - a technical reset that often precedes sustained directional moves.
The $145 Level Re-enters Focus on USOIL Chart
A major horizontal level sits near $145-$146, clearly visible on the chart as a long-term resistance zone. This level represents a prior ceiling and now becomes the next key test as price continues higher. The projected path shows price moving through this region and extending toward significantly higher levels.
That projection reflects a continuation wave rather than a short-term spike - indicating a potential structural expansion rather than a temporary rally. WTI crude oil breakout setup points to major structural shift, a dynamic now echoed in the USOIL chart structure.
From Correction to USOIL Expansion Phase: 3 Key Signals
What defines the current setup is the transition from a multi-year corrective structure into a directional move higher. The chart shows a clear shift across three stages:
- A completed decline into the $50-$55 support zone
- A sharp reversal with strong upward momentum
- A projected continuation toward the $180 region
This type of structure reflects a market that has moved beyond consolidation and is now entering a potential expansion phase. Similar long-term breakout setups have historically led to outsized moves once major resistance zones are cleared, especially after prolonged consolidation phases. WTI oil hits $114 amid strong upward momentum - a reference point for how quickly price can accelerate once structure shifts at scale.
With price already accelerating and reclaiming key technical levels, the focus shifts toward how it behaves as it approaches the $145 resistance zone on its way to $180.
 Alex Dudov