 Marina Lyubimova
Silver (XAG) has broken above $46, driven by powerful momentum after years of sideways consolidation. The metal now faces its most significant test in years as it approaches the psychologically important $50 resistance zone.
From Downtrend to Accumulation and Markup
The chart shows a textbook market cycle. Following a steep decline from the $49–$50 peak, silver spent years grinding sideways in a $14–$20 range. This accumulation phase absorbed excess supply while smart money quietly built positions. As trader Heisenberg noted, this transition from stagnation to acceleration often signals the start of major bull cycles.
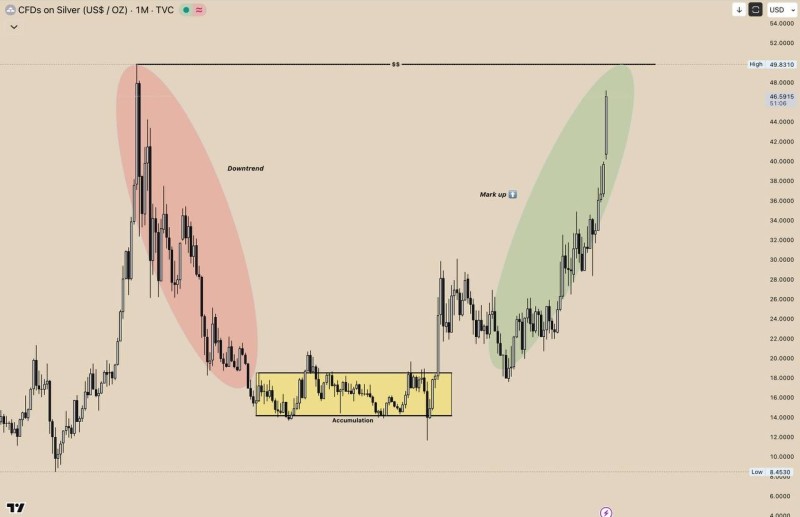
The market has now entered a markup phase, pushing prices sharply higher. The latest move has driven XAG/USD near $46.60, and bullish momentum suggests the $49.80–$50 zone could be tested soon.
Technical Chart Insights
The $49.80–$50 region remains the key ceiling that silver must overcome. Breaking cleanly above this level would likely trigger another leg higher and attract fresh buying interest. On the downside, the $36–$38 zone has flipped to support after the recent breakout, offering a cushion if prices pull back. The steep angle of the rally indicates aggressive buying, though it also increases the likelihood of near-term consolidation or a correction as traders take profits.
Why Silver Is Rising
Multiple factors are converging to support silver's rally. Persistent inflation above central bank targets has renewed interest in precious metals as a hedge against currency debasement. Rising geopolitical tensions are also driving capital into safe-haven assets. Beyond investment demand, silver's industrial applications continue expanding, particularly in solar energy production where it plays a crucial role. This dual demand from both investors and industry creates a unique supply-demand dynamic that supports higher prices.
 Marina Lyubimova


