 Marina Lyubimova

⬤ Silver has entered historically extreme territory after a powerful rally that took off following its late-2025 breakout. Current market conditions mirror those last seen during the legendary 1979–1980 silver surge. The long-term chart shows silver breaking decisively above multi-decade resistance and accelerating into early 2026, pushing prices far beyond previous cyclical ranges.
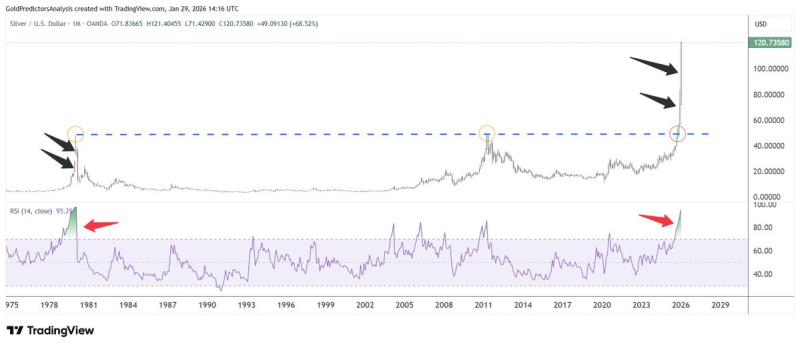
⬤ Silver blasted through $50 in October 2025 and has jumped more than 140% in just three months since that breakout. Historical data shows that major silver rallies tend to be highly compressed in time—both the 1979 and 1980 advances unfolded within roughly five months, a pattern now being closely watched in the current move.
The current price action represents conditions we haven't witnessed in the silver market for over four decades.
⬤ Technical indicators highlight just how exceptional this rally has been. The long-term price structure shows repeated historical peaks near the same resistance zone, now clearly blown through. Meanwhile, the relative strength index has rocketed to extreme levels comparable to previous historic tops. This combination of vertical price movement and elevated momentum shows how unusual current silver behavior is when viewed across several decades.
⬤ This matters for the broader market because silver's rapid climb signals rising volatility across the precious metals complex. Moves of this size can ripple through commodities and related markets, especially when prices hit levels tied to past extremes. The 1980 comparison underscores how fast silver can move once key levels break, making this price action a critical marker for assessing risk and trend strength in precious metals as 2026 unfolds.
 Marina Lyubimova


