 Saad Ullah

After weeks of quiet consolidation, platinum is making a move. The metal bounced firmly off the $2,000 level and closed above the 50-day exponential moving average, giving bulls their first meaningful signal in February 2026. Whether this breakout holds or fades is the question every trader is asking right now.
$2,000 Holds as Platinum Reclaims the 50 EMA
Platinum spent most of February trading below its 50-day EMA, slowly compressing into a tight pennant pattern. That kind of structure typically reflects a market catching its breath before the next directional move. According to recent analysis, bulls printed a strong continuation candle right off the $2,000 support zone, closing near session highs and reclaiming the 50-day average in the process. Primary source: platinum holds 2000 support 50 EMA test looms as market consolidates.
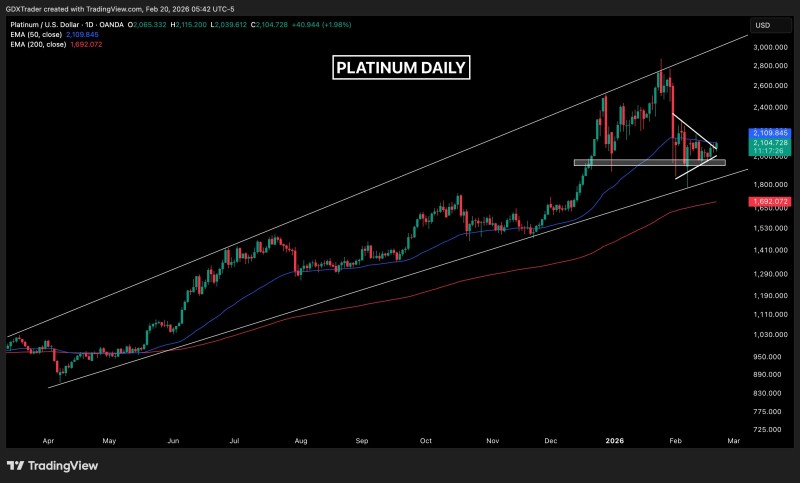
The $2,000 level has been tested multiple times over recent months and has held each time, making it a clear demand zone for buyers. Meanwhile, the broader price structure throughout late 2025 and early 2026 traces out an ascending broadening wedge — a pattern defined by higher highs and higher lows that signals an ongoing uptrend, even when short-term volatility picks up.
Bulls printed a strong continuation candle following a pennant-like trading pattern below the 50 EMA, with the $2,000 level serving as a firm demand zone.
What Happens Next for Platinum?
The key level to watch now is the $2,100 area. A clean hold above the 50 EMA in that zone could give platinum the technical foundation it needs to push higher within the ascending wedge, potentially targeting new highs. Momentum has clearly shifted compared to the earlier consolidation phase, and dips toward major support have consistently attracted fresh buying interest.
That said, the risk scenario is worth keeping in mind. If platinum fails to stay above the 50 EMA, price could drift back into sideways trading and put the $2,000 support back under pressure. Broader analysis, including coverage on platinum bear flag near $2,000 support signals $1,700 risk, outlines how prolonged consolidation near key support can eventually tip into a sharper decline if buyers step back.
For now, the chart leans bullish. The bounce off $2,000, the reclaimed 50 EMA, and the broader uptrend all point in the same direction. But confirmation above $2,100 will be the real test of whether this rally has legs.
 Saad Ullah


