 Peter Smith

⬤ The gold-to-silver ratio has been stuck in a tight range, and recent chart patterns point to a quick spike up before a sharper drop. The ratio could temporarily touch the 74 area before changing direction. The structure shows descending resistance meeting horizontal support—classic signs of compression before a breakout.
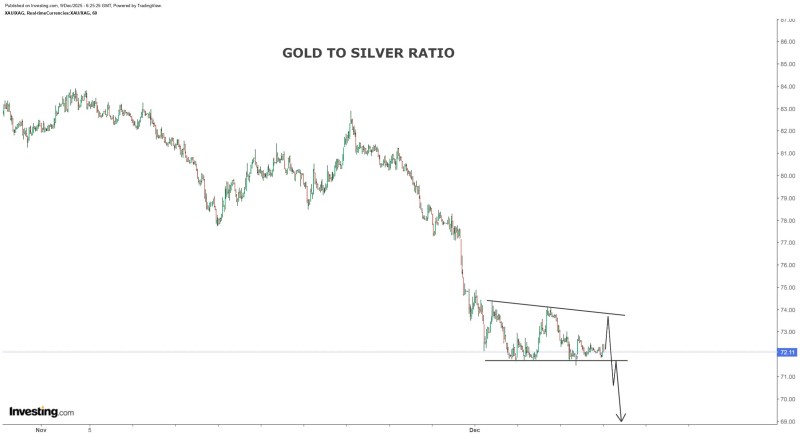
⬤ A breakdown in the ratio would signal silver gaining ground against gold. The analysis suggests a move from the 74 region to below 70 could happen alongside silver pushing toward $63 first, then into the $70-plus zone. The chart backs this up, showing a potential bounce off resistance followed by a projected leg down that matches the expected price path for silver.
⬤ The broader trend in the XAU/XAG ratio has been tilting downward, with silver outperforming during certain periods. The chart shows repeated bounces near the 72 level while overhead resistance keeps tightening. This kind of squeeze usually comes before a decisive break, and if the ratio drops below support, silver could take the lead.
⬤ Changes in the gold-to-silver ratio often reveal shifts in market mood within precious metals. A meaningful drop could point to stronger industrial demand for silver or improving economic conditions that typically lift the metal. How the ratio moves around these key levels will likely shape the direction of precious metals in the weeks ahead.
 Peter Smith


