 Marina Lyubimova
⬤ Gold (XAU) keeps pushing higher while analysts are tracking how this rally stacks up against the metal's long-term cycle patterns. A chart mapping Gold's performance shows a pattern of roughly seven-year cycle lows going back to 2001. The current move is being compared to the previous bull market to see if we're getting close to a top.
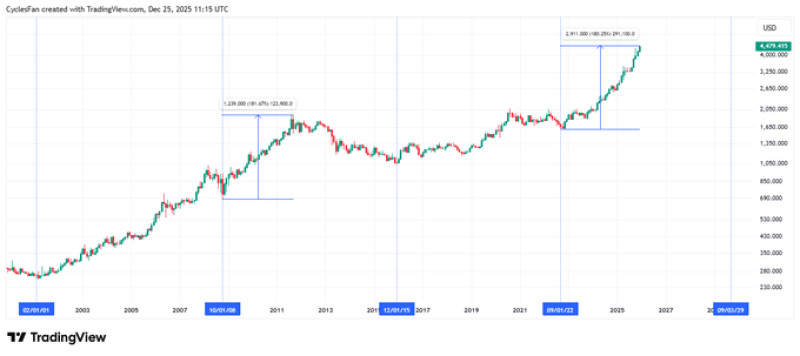
⬤ The rally that started from the 2008 cycle low ran for 35 months and delivered 181% gains before hitting its peak. That's the benchmark being used to measure where Gold stands right now. It's basically the same playbook the market ran last time around.
⬤ We're now 39 months into the current rally from the 2022 bottom, sitting at roughly 180% gains. That puts this move almost exactly in line with what happened during the last bull market—same size, similar duration. The numbers suggest Gold might be approaching a bull market top since this cycle has already outlasted the previous one while matching its percentage climb.
⬤ This matters because Gold is still a major global indicator tied to macro sentiment, inflation fears, and where money flows. When XAU starts moving like it did at past cycle peaks, traders pay attention to whether the trend is running out of steam or if there's more room to run after a multi-year climb.
 Marina Lyubimova


