 Saad Ullah

⬤ The Gold to S&P 500 ratio (XAUUSD/SPX) just punched through a long-term downtrend line after years of sitting quiet. The breakout finishes what looks like a multi-bottom base pattern, showing gold is starting to outmuscle equities. The ratio's sitting around 0.646 right now, up almost 5 percent today, after forming several rounded lows over the past few years.
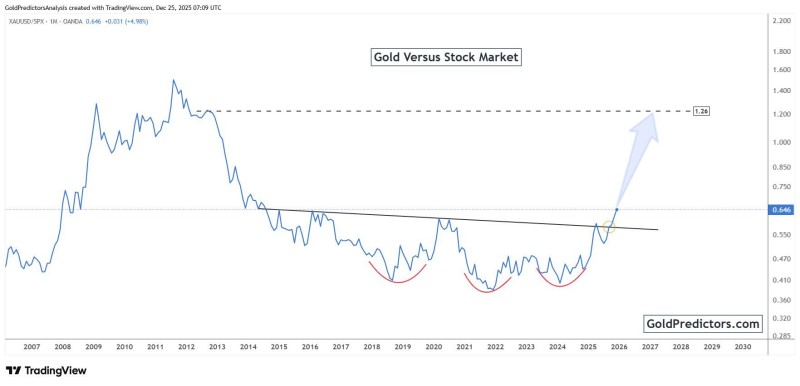
⬤ The chart shows the downtrend line from 2011-2013 has been cracked to the upside, marked with a yellow circle around the breakout spot. A light blue arrow points toward 1.26, which is the next key resistance zone analysts are watching. Gold's ratio to the S&P 500 peaked near 2.0 over a decade ago, then slid for years before building this base with three distinct rounded bottoms—and now XAU is pushing higher against stocks.
⬤ The chart uses a monthly timeframe, meaning this isn't about day-to-day noise—it's a longer-term structural move. Gold is starting to outperform equities on a relative basis, which matters because major breakouts in this ratio usually mean investors are rethinking the balance between financial assets and hard assets like gold.
⬤ If the ratio keeps climbing, it shows gold getting stronger compared to stocks, which could shake up broader market sentiment and change how people allocate their money between equities and real assets. The 1.26 target represents the next major test for this trend.
 Saad Ullah


