 Marina Lyubimova

⬤ Gold (XAU/USD) hit a wall near the $4,857–$4,863 zone and couldn't push through, bringing sellers back into the picture. Trading below $4,837 keeps the near-term bias pointing down, with the metal showing clear signs of exhaustion after its recent climb. The chart reveals multiple failed attempts to break above this resistance band, suggesting bulls are losing steam right where it matters.
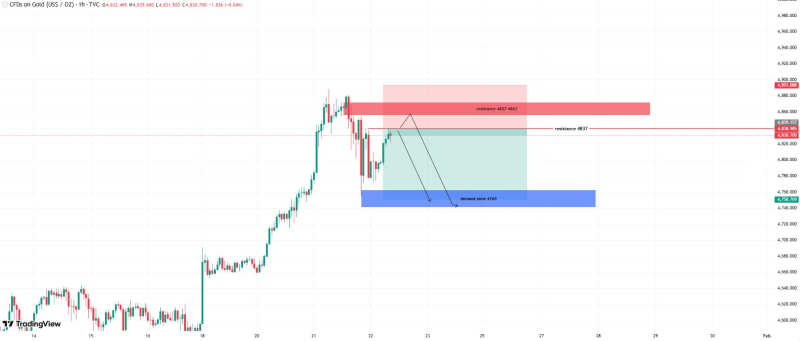
⬤ Looking at the hourly structure, that $4,857–$4,863 area has turned into a solid ceiling. Each time prices approached this zone, they got pushed back down.
Price action below 4,837 keeps the short-term outlook biased to the downside.
As long as gold stays beneath $4,863, sellers appear to be running the show. A clean break and hold above that level would be needed to flip the script.
⬤ If the selling continues, the next meaningful support sits around $4,760—that's where buyers might step back in. This isn't about a complete trend reversal yet, more like a technical pullback within the current range. The space between resistance near $4,860 and demand around $4,760 defines the current battleground where the next directional move is taking shape.
⬤ What makes this setup interesting is that gold's still trading at elevated levels after a strong run-up, so how it behaves at these technical points really matters. Continued rejection below resistance keeps $4,760 in play as the next downside target, while any move above $4,863 that actually sticks would change the whole picture. For now, gold's locked in a holding pattern, waiting for the market to pick a direction at these well-defined levels.
 Marina Lyubimova


