Usman Salis

⬤ Gold's price action has found some footing after getting hammered lower, climbing back toward the $2,637 zone as buyers stepped in to catch the dip. The bounce has taken some heat off, but we're still stuck in a pattern of lower highs and lower lows—so the trend hasn't actually flipped bullish yet.
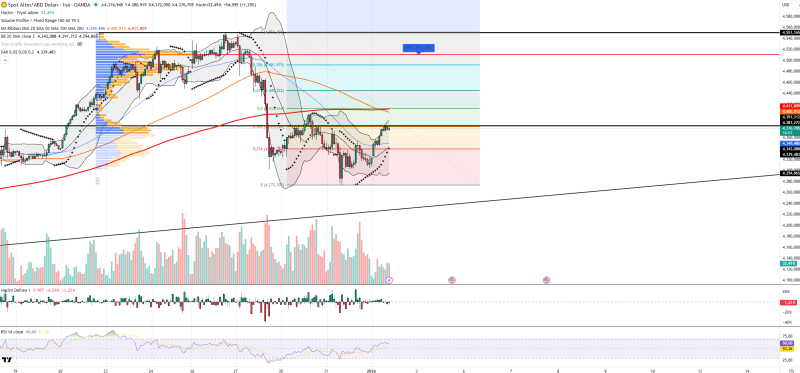
⬤ Right now, price is bumping into a key horizontal resistance area that lines up with a moving-average crossover on the hourly chart. The RSI's climbed back to around 60, showing decent momentum without being stretched. We're seeing more volume come in on green candles, which tells us buyers are active—but here's the catch: volume delta is still negative, meaning sellers are showing up even as price rises. Gold's also hovering near the middle Bollinger Band (usually a reaction zone), and the Parabolic SAR hasn't flipped below price yet, so there's no technical confirmation of a fresh uptrend.
⬤ Key support sits at $2,634.90, $2,633.90, $2,630.30, and $2,627.40. Resistance is stacked at $2,638.10, $2,639.50, $2,641.10, and $2,645.10. The volume profile shows a heavy supply zone near $2,651.10—if price pushes higher, that's likely where sellers will dig in. For now, this move up looks more like a technical bounce within a larger pullback rather than the start of something bigger.
⬤ Short-term support for gold is coming from oversold conditions and lingering geopolitical jitters. But the headwinds are real: expectations for high US interest rates and a strong dollar are still weighing on XAU. That's keeping sentiment cautious—this price action feels more like tactical reaction trading than a true directional shift.
 Usman Salis