Usman Salis

Gold has entered one of its strongest multi-year runs in modern history—climbing from around $1,040 in the mid-2010s to over $4,000 today. The surge has been fueled by persistent inflation, easy monetary policy, and mounting global uncertainty.
What the Chart Is Telling Us
Even after this massive run-up, analyst Kamile Uray notes there are no technical signs the uptrend is over. In fact, the weekly chart structure suggests gold may still have room to climb before hitting serious resistance.
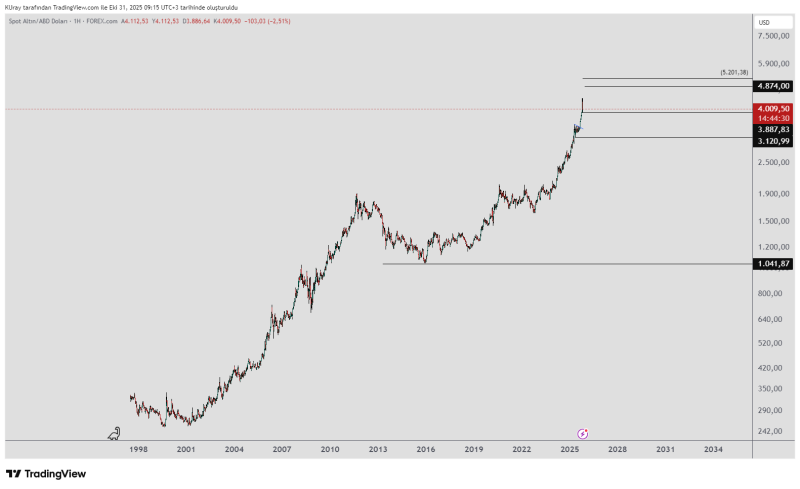
The long-term picture shows clear structural strength—a steady pattern of higher highs and higher lows that's held for nearly two decades. Here's what matters right now:
- $3,120 — The Critical Support Level: This is the line in the sand. As @remdocan points out, "Remaining above this level on the weekly timeframe should be viewed positively." Gold is comfortably above it, which suggests the recent dip is just a healthy pause, not a trend reversal.
- $4,800–$5,200 — The Next Resistance Zone: Gold recently hit a new all-time high near $4,874 before cooling off. The next major test sits between $4,800 and $5,200—this is where the rally could finally run out of steam. If gold reaches this zone, traders will be watching closely for signs of exhaustion or distribution. But for now, there's no confirmed reversal.
- Macro Support from $1,040 Base: Below all the current action is the historical $1,040 floor from 2015–2016, where this entire supertrend began. It's a reminder of just how long gold has been building upward momentum.
The recent acceleration looks parabolic—a pattern often seen late in bull markets. But as notes, watching how the next wave forms near the top will be key to understanding whether this is a mid-cycle breather or the final push before consolidation. Meanwhile, gold's strength is backed by some solid macro drivers: ongoing inflation concerns, central banks keeping real rates low, geopolitical tensions, and a growing trend of countries diversifying away from the dollar.
The Bottom Line
From a technical perspective, gold's long-term trend is alive and well. Even after decades of gains, the chart shows no structural cracks—just a potential cooling phase before another leg up. As long as gold holds above $3,120 on the weekly timeframe, the bullish case stays intact. The next big test lies between $4,800 and $5,200, which could mark the final wave before a real correction. Until then, gold continues to prove itself as one of the world's most resilient assets in uncertain times.
 Usman Salis