Peter Smith

⬤ The gold miners-to-gold ratio just moved higher, marking a notable shift in relative strength after years of lagging performance. The long-term chart shows the ratio climbing toward its highest levels in several years and breaking above a descending trendline that's been in place since the mid-2000s. Gold miners are now starting to outperform gold itself, reflecting growing market interest in how strongly mining companies can benefit when the metal trades at elevated prices.
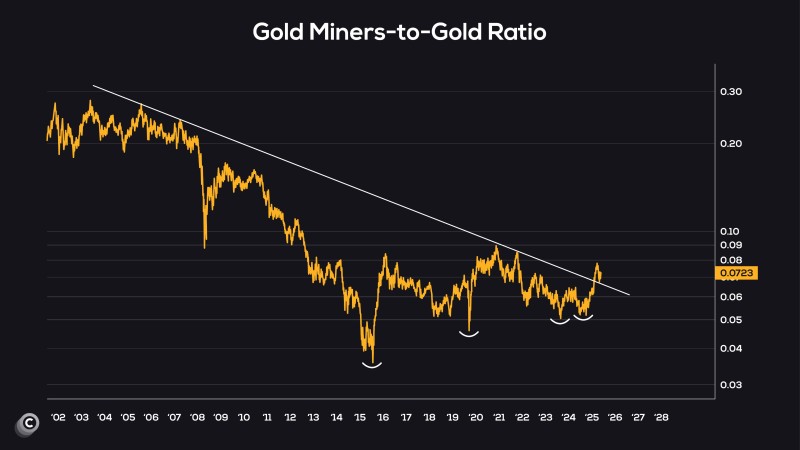
⬤ The chart shows a multi-year bottoming pattern with rounded lows forming since 2016. The latest reading near 0.0723 represents a clear break from the prolonged downtrend. These kinds of breakouts have historically lined up with periods when gold stabilizes at high prices and miners see amplified performance thanks to operational leverage. Investors seem to be reassessing the mining sector's earnings potential as gold continues holding near the upper end of its long-term range.
⬤ This structural shift comes after years of compressed valuations for miners relative to bullion. The upward move in the ratio suggests sentiment may be turning as expectations for a broader metals cycle gain momentum. The chart's long-term reversal pattern, combined with renewed strength, supports the idea that miners could outperform if a sustained commodities rally takes hold. In a true metals bull market, miners often end up outperforming the metal itself.
⬤ The gold miners-to-gold ratio works as a sentiment gauge for the entire precious metals sector. Rising relative strength typically means market participants expect stronger margins and better operational performance from mining companies. With talk of a multi-year metals expansion growing and gold maintaining historically strong pricing, the shift in this ratio suggests capital may increasingly flow toward miners as a leveraged play on potential future gains.
 Peter Smith