 Marina Lyubimova

⬤ Tesla shares are sliding toward $420.69, a price level that's turned into a critical test zone after the recent pullback. This area is expected to show whether selling pressure is running out of steam or if there's more downside ahead. The chart marks $420.69 as the spot where price action could set the direction for what comes next.
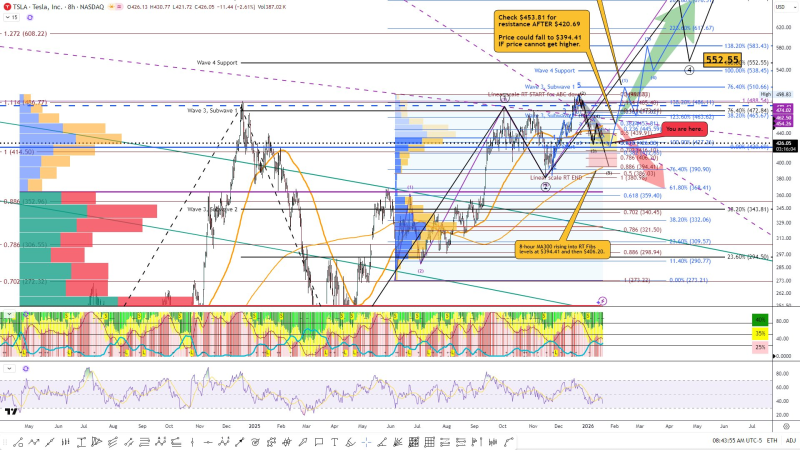
⬤ If Tesla manages to stabilize around $420.69, the focus shifts to $453.81—the major resistance barrier sitting above current levels. A clean move back above $453.81 would flip the script, suggesting buyers are back in control and opening the door for a bigger push higher. That level separates a short-term bounce from something more substantial.
This price zone is expected to act as an initial test to determine whether selling pressure is stabilizing or whether further downside risk remains.
⬤ But if Tesla can't reclaim $453.81, lower support levels come into play. The chart shows $406.20 and $394.41 as the next stops if weakness continues. A quick break through $420.69 raises the odds of testing those deeper support zones, with sub-$400 prices becoming a real possibility if the floor doesn't hold.
⬤ What makes this setup matter is the convergence of technical signals right where Tesla is trading now. The 8-hour MA300 sits near current price levels, adding weight to this support zone. How shares respond around $420.69—and whether they can punch back above $453.81—will shape volatility and sentiment for the next leg of the move.
 Marina Lyubimova


