 Eseandre Mordi

⬤ Tesla has been climbing steadily after wrapping up a double corrective pattern at the $380.79 mark. The decline from October's peak bottomed out at that level, and since then, the stock has shifted into an upward trajectory. The latest chart shows a completed W–X–Y structure with clear signals that TSLA is moving higher while holding above the November low that anchors the current bullish outlook.
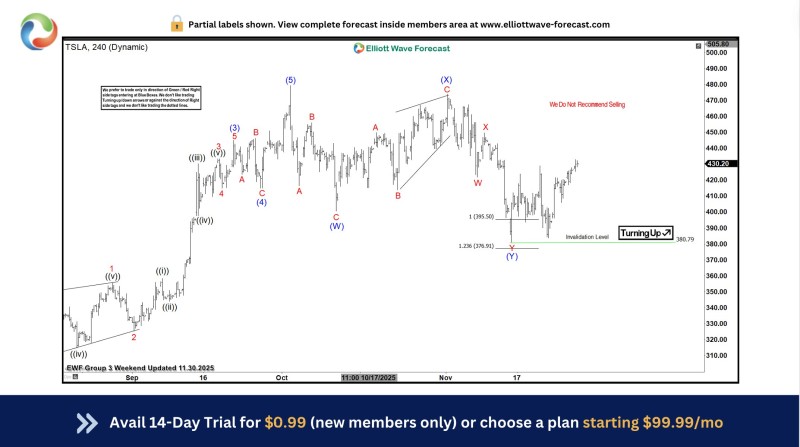
⬤ The chart shows the bounce from $380.79, which marks the end of the corrective cycle. From there, Tesla has pushed higher through a series of upward movements that point toward further gains. Analysis suggests the stock could head toward $502.6 or beyond if the momentum holds, with a broader target zone stretching between $502.6 and $540. The invalidation level sits below recent lows, marking the line that would cancel out this bullish scenario.
⬤ The structure also hints at a possible three-wave progression that could take TSLA back toward October's peak if the rally keeps going. The "Turning Up" signal backs up the idea that Tesla has entered a positive phase after finishing its correction. Additional chart notes discourage selling, reinforcing the upward bias shown by the wave analysis.
⬤ This matters for the broader market because Tesla is a heavyweight in growth-focused equity benchmarks. If its rally continues, it could lift sentiment across the tech sector and shape near-term expectations for high-beta stocks. The clean resolution of the corrective pattern gives useful context to the recent recovery and provides a roadmap for tracking whether Tesla can reach those projected levels.
 Eseandre Mordi


