Usman Salis

⬤ Tesla shares are holding firm technically as the company approaches its earnings release, with the price action showing a significant improvement in long-term structure. Recent momentum shifts appear connected to real progress in Tesla's self-driving technology and robotics programs rather than just short-term hype. The monthly chart reveals a rounded bottom pattern that's been forming over multiple years—typically a sign that investors have been steadily accumulating shares during a long consolidation period.
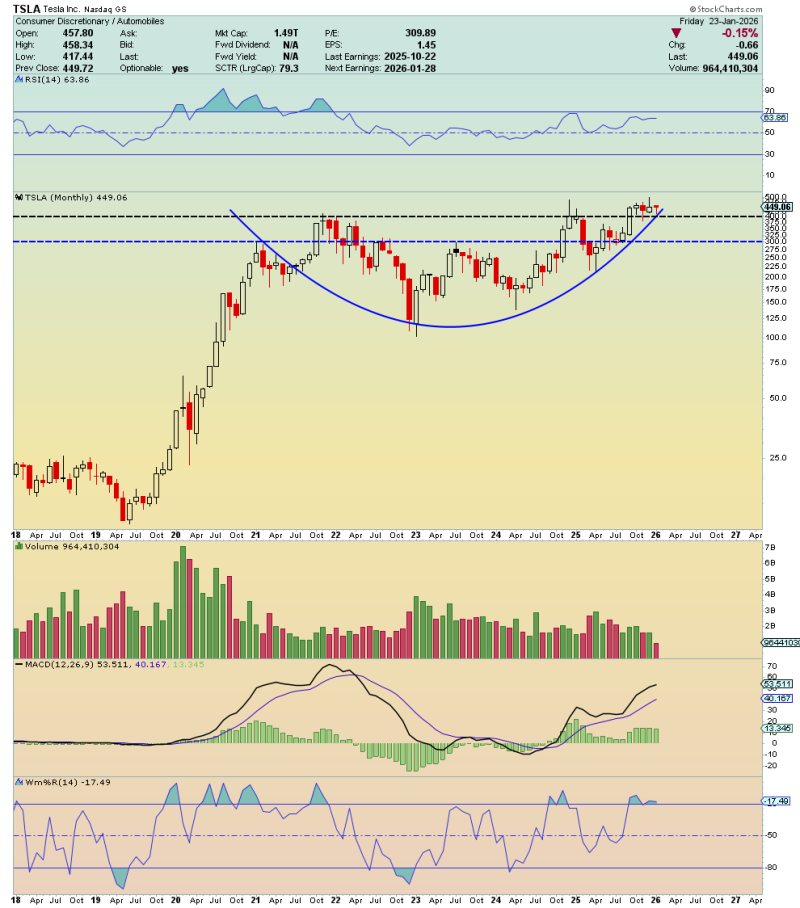
⬤ Looking at the technicals, TSLA has carved out a solid support zone between roughly $392 and $421. These levels used to act as resistance but have now flipped to support—a bullish sign. The stock recently traded around $449, sitting comfortably above this range while consolidating below longer-term resistance areas. Momentum indicators like RSI and MACD are trending upward but haven't hit extreme levels yet, suggesting the strength is building without the stock getting overheated.
⬤ Volume patterns on the chart look steady rather than explosive, which reinforces the idea that this move is developing gradually. The rounded base structure, combined with higher lows in recent months, points to growing confidence in Tesla's long-term prospects. While the stock hasn't broken through the $500 psychological level yet, the current setup suggests TSLA is laying the groundwork for a sustained rally rather than a quick pop.
⬤ This technical picture matters because it puts Tesla at a critical point heading into earnings. As long as the stock holds above that established support zone, the broader bullish structure stays intact. A decisive push toward higher resistance levels could shift sentiment across the entire EV and tech sectors. The chart shows how Tesla's price action is increasingly being driven by long-term fundamentals and strategic developments rather than just short-term trading patterns.
 Usman Salis