 Eseandre Mordi
⬤ Oracle staged a notable recovery this week after finding solid footing around its 50-week moving average. The stock stabilized near last year's high, reigniting interest in its long-term chart structure. After weeks of declining closes, ORCL pushed back into the $198-$203 zone where the 50-week average intersects with a significant historical price point.
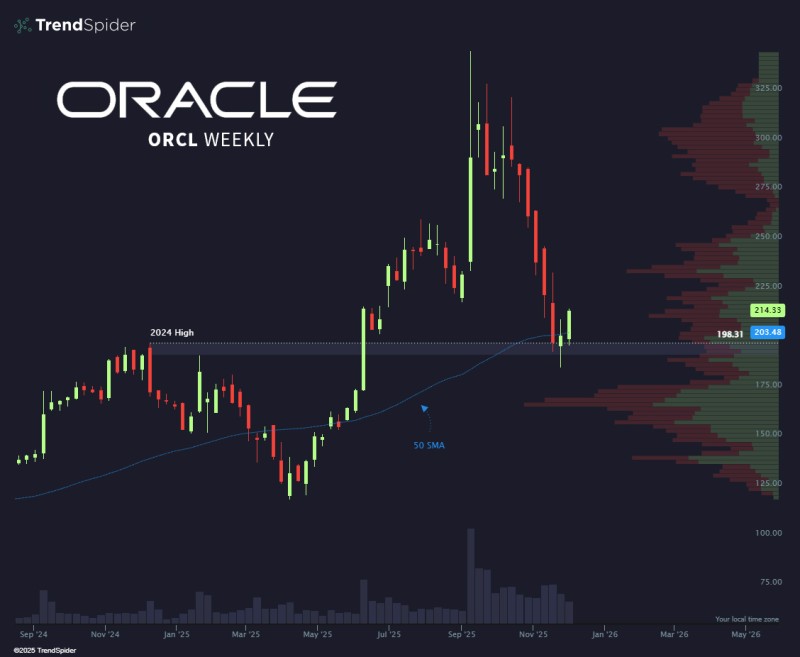
⬤ The weekly chart shows how Oracle faced consistent selling pressure since topping out earlier this year. But the recent bounce near this key support level marks an important shift. Buyers stepped in at a critical technical junction, and dense trading volume around the $200 range confirms this area's significance for future price movement.
⬤ If the rally holds, the next meaningful resistance sits near $214 based on volume profile data. Recent weekly candles suggest Oracle may be forming a higher low after several sharp drops. The combination of the 50-week moving average and last year's high creates a powerful support zone that's proving its strength.
⬤ This matters because Oracle's ability to defend major weekly support levels could help stabilize sentiment across large-cap tech stocks. Staying above key trend indicators like the 50-week average strengthens confidence and may shape market expectations heading into early 2026.
 Eseandre Mordi


