 Saad Ullah
Nvidia (NVDA) has been a standout performer in this year's semiconductor rally, and its chart suggests momentum may be building for another explosive move. The stock is forming a classic volatility contraction pattern (VCP), with one more higher low potentially setting up a breakout through key resistance levels.
Nvidia Chart Shows Classic VCP Setup
TrendSpider analysis reveals Nvidia's daily chart displays multiple higher lows and clear price compression just below the $184.50 resistance zone. This VCP pattern typically indicates institutional accumulation before a continuation move higher.
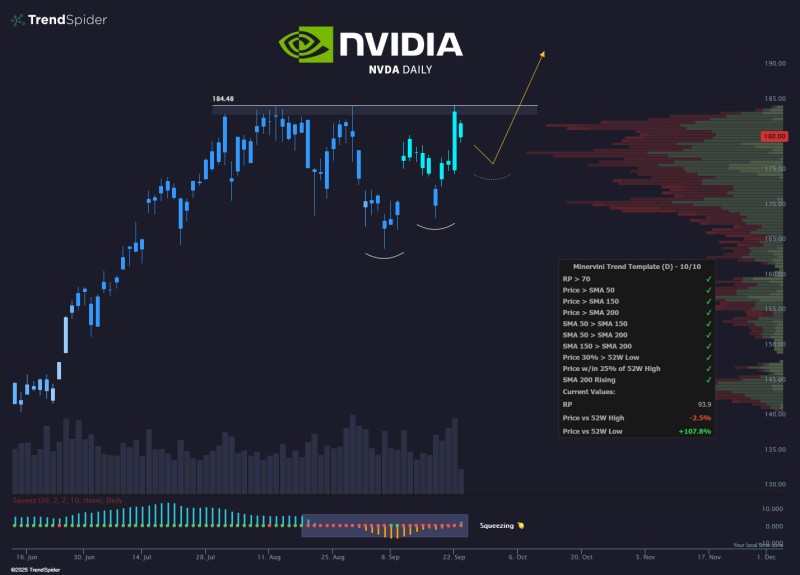
Key chart observations include strong support at the $170 area where NVDA has consistently bounced, reinforcing solid demand levels. The $184.50 level remains the primary resistance ceiling, and a decisive close above this point would confirm the breakout. Trading volume is concentrated around the $175–$180 range, establishing this as a critical accumulation zone. Additionally, the 50-, 150-, and 200-day moving averages are all trending upward, reflecting a robust underlying trend.
Why Momentum Is Building
Several factors are driving Nvidia's technical setup. The company remains central to the AI hardware revolution, generating unprecedented GPU demand as artificial intelligence applications expand across industries. Institutional sentiment stays strong, with Nvidia's relative strength rating above 90, indicating continued professional interest. From a technical standpoint, the stock trades just 2.5% below its 52-week high while sitting over 100% above its lows - classic characteristics of a market leader.
What to Watch Next
If the VCP completes with another higher low, NVDA could break through $184.50, opening a path toward $190 and potentially higher targets. However, failure to maintain the $170 support zone could trigger short-term consolidation before the next breakout attempt.
Bulls Eye a Breakout
Nvidia's chart structure remains decidedly bullish, with higher lows and strong technical support pointing toward continuation. A breakout above $184.50 would confirm institutional accumulation and could launch another powerful upward leg. Traders should monitor volume dynamics and support levels closely as Nvidia approaches this decisive technical juncture.
 Saad Ullah


