 Marina Lyubimova

Nvidia (NVDA) has delivered impressive gains throughout 2025, but recent price action hints that the rally might be losing steam. The stock is now consolidating near a key resistance level, and many traders are eyeing a potential pullback in the coming sessions.
Technical Setup
According to Prof trader's analysis, Nvidia's daily chart reveals a clear horizontal resistance zone between $190 and $191. The price has been moving within a tightening range, creating what looks like a rising wedge pattern - typically a sign that upward momentum is fading after an extended run.
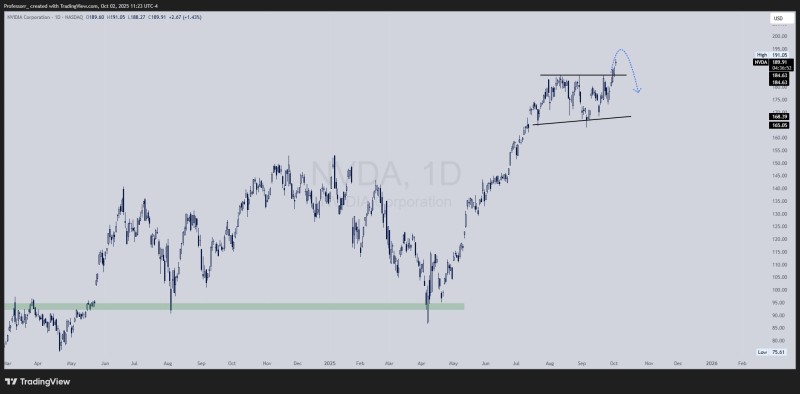
The resistance at $190–191 has proven difficult to break, with multiple failed attempts by buyers to push through. If the stock does pull back, the first support level sits around $185, where bargain hunters may step in. However, if selling pressure intensifies, the next meaningful support doesn't appear until around $168. The technical projection suggests a rejection from current levels could send the stock down toward $185, where the real test will begin.
Why It Matters
Nvidia has been grabbing headlines all year, fueled by surging demand for AI infrastructure and data center expansion. But with valuations stretched and the stock looking overextended, technical patterns carry more weight than usual. The $185 zone is crucial - holding above it would signal that bulls are still in control, while breaking below could open the door to a sharper correction toward $168.
What's Next
Nvidia's growth narrative isn't in question, but the immediate setup warrants careful attention. How the stock behaves around $185 could define its direction for weeks to come. Traders will be watching closely to see if this consolidation turns out to be a healthy pause or the start of something more significant.
 Marina Lyubimova


