 Saad Ullah

The chart tells the real story here. NIO is riding a rising channel with volatility holes and momentum bars showing where the smart money is accumulating. Don't get fooled by those red and yellow daily candles that spook retail traders. The momentum bars and volatility holes are what you need to watch - they show the real accumulation zones way better than fancy candle patterns.
The Three Levels That Changed Everything
NIO just pulled off something impressive. After getting stuck between $3.80 and $5.00 for months, the stock finally broke free and reversed its downtrend. Danny cheng highlighted how this wasn't just luck - it's backed by solid momentum signals that actually matter.
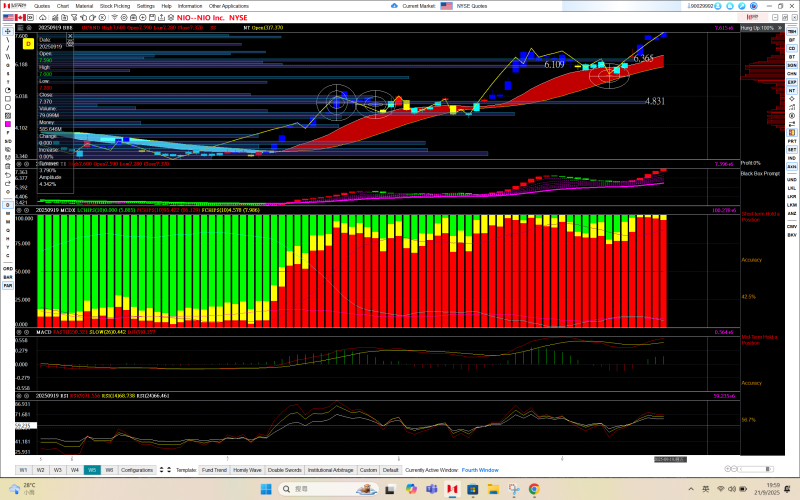
- $4.83 – Where the breakout started and whales began loading up
- $6.10 – Former resistance flipped to support, confirming the uptrend
- $6.36 – The latest breakout level hinting at more gains ahead
Those volatility holes around $5.00 and $6.20 weren't accidents either. They confirmed each breakout and historically led to quick rallies when NIO pushed through them.
Smart Money is Moving
Every major breakout lined up perfectly with whale accumulation periods. That's institutional money betting big on NIO at these exact levels. Those longer momentum bars you see on the chart? They carry way more weight than short-term noise, making them solid indicators for anyone thinking medium to long-term.
Sure, retail sentiment is all over the place because of day-to-day volatility, but the bigger picture is clear. As long as NIO stays above $6.10 and $6.36, this uptrend has legs.
If this momentum holds, NIO's next target sits around $7.60, with room to run higher if buying volume keeps up. Looking further out, this bullish channel could take the stock back toward $10.00-$10.50 territory. For long-term players, any pullbacks to those strong support zones could be golden buying opportunities. Short-term traders should wait for clean breaks above these breakout levels before jumping in for the next momentum wave.
 Saad Ullah


