 Artem Voloskovets

⬤ Meta's recent sell-off has pushed the stock right onto a crucial support zone while momentum indicators flash oversold warnings. The price is now sitting at $595, right where a key trendline meets horizontal support—the same spot that marked a major bottom before. The RSI has dropped to around 30, showing just how intense this pullback has been.
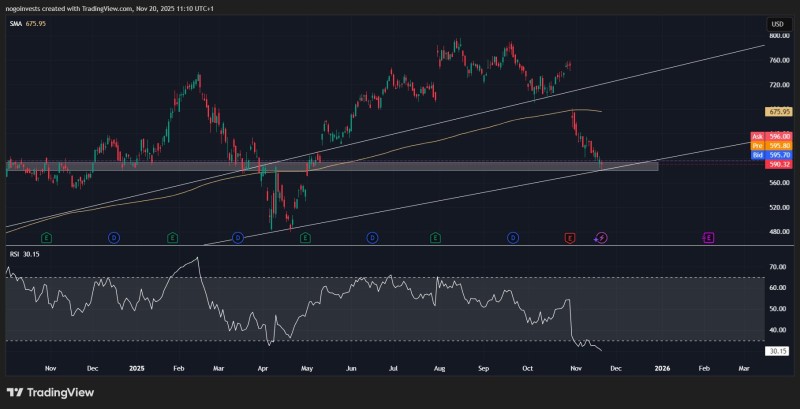
⬤ The chart reveals META breaking sharply lower over recent weeks before finding its footing at a long-term uptrend line. This level has worked as an accumulation zone several times this year. The RSI just hit oversold territory for the first time since earlier drops, and the stock is back at a horizontal support area that's triggered strong buying in the past. The last time META showed this same combo of trend support and oversold RSI, it surged more than 65% within four months.
⬤ The broader market structure still shows a pattern of higher long-term lows, even with the recent pressure. META's price is reacting right at the lower edge of its multi-month channel, which lines up closely with the 200-day moving average zone. The key support area suggests that if buyers return here, we could see renewed upside momentum. While short-term momentum stays weak, this support cluster creates solid conditions for a potential reversal if the stock holds current levels.
⬤ This setup carries weight because META has reached a level that's historically acted as a turning point for broader sentiment toward large-cap tech stocks. When oversold readings meet long-term structural support like this, it often influences near-term volatility and shapes recovery expectations. If support holds firm, it could boost confidence across the entire sector, but a break below might extend the current correction further.
 Artem Voloskovets


