 Artem Voloskovets

⬤ IREN just pulled off something traders have been waiting months to see—a clean break above $51.50 that's actually holding. The stock finally closed above this stubborn resistance level on the weekly chart, flipping the technical picture even while the broader market stays messy. What makes this interesting isn't just the breakout itself, but how price is behaving afterward. Instead of the usual fake-out where it pops and drops right back down, IREN is staying put above the level, suggesting real buyer conviction.
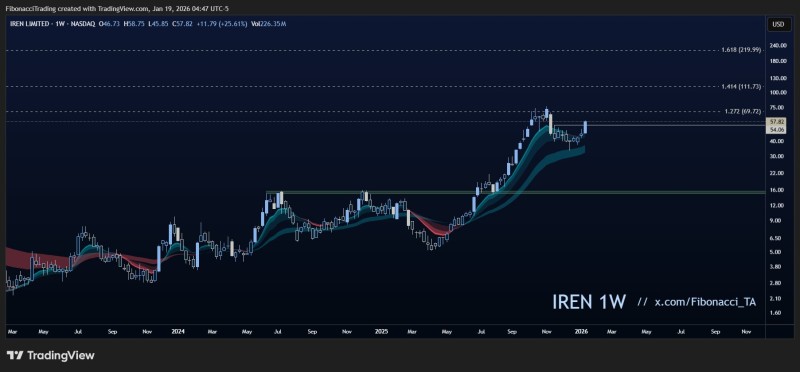
⬤ The weekly chart tells the story of a stock that's been coiling up for a while now. Throughout 2024 and into early 2025, IREN built out a multi-month base—basically going nowhere but setting up potential energy. After several head-fake attempts that couldn't stick, the $51.50 level finally gave way. The difference this time? Follow-through. Price isn't just sitting right above the breakout zone nervously—it's continuing to build higher, which is exactly what you want to see when a technical pattern is working.
⬤ So where does this go from here? The chart shows Fibonacci extension targets that give us a roadmap. First stop looks like $70, which lines up with the initial projection zone. If momentum keeps building and the structure holds together, there's a longer-term target sitting around $111 further up the chart. What's encouraging is that pullbacks so far aren't breaking the pattern—they're staying above what used to be resistance, which is now acting as support.
⬤ Why does this matter beyond just IREN? When a stock confirms a weekly reversal like this, it often signals that the medium-term trend is shifting gears. The fact that IREN turned a long-term resistance level into support changes how the stock might trade going forward. Sure, outside factors can still shake things up, but the technical structure is showing something important: when a stock decisively holds above a key level, it tends to reset what traders expect from it next.
 Artem Voloskovets


