Saad Ullah

⬤ Intel continues trading within a corrective structure on the daily chart following its previous advance. Wave B is still developing, with no confirmed reversal in sight yet. The chart suggests patience is needed as the correction plays out, rather than assuming the recent pullback marks a completed bottom.
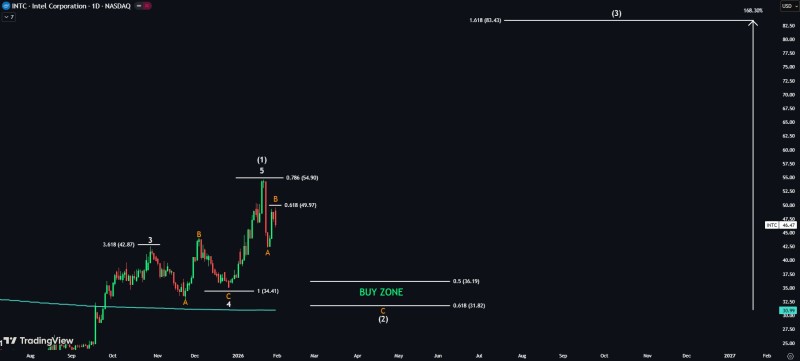
⬤ Intel recently rejected the 0.786 Fibonacci retracement near $54.90, which lines up with the Wave (1) high. Price then pulled back toward lower retracement levels, with interim resistance around the 0.618 level near $49.97. This movement fits a corrective Wave B pattern rather than signaling a new impulsive rally.
⬤ The critical support zone highlighted centers on the 200-week moving average, which also aligns with the 0.618 Fibonacci retracement in the low-$30s area. A final downside push into this region would complete the correction while keeping the broader bullish structure intact instead of marking a trend reversal.
⬤ This technical setup matters for the wider market since Intel plays a major role in the semiconductor sector. A solid bounce off the 200-week moving average could restore upward momentum and support expectations for a larger Wave 3 advance. "The behavior around long-term support serves as a key reference point for overall market sentiment," according to the analysis. The projected move shows potential upside of roughly 168 percent from the corrective low, making this support level crucial for gauging what comes next.
 Saad Ullah