 Saad Ullah
⬤ HIMS shares have dropped into a critical technical support area identified through harmonic chart analysis. The setup shows a harmonic bat pattern pointing to a potential buying opportunity between $17.5 and $20 after the stock's significant decline from higher levels.
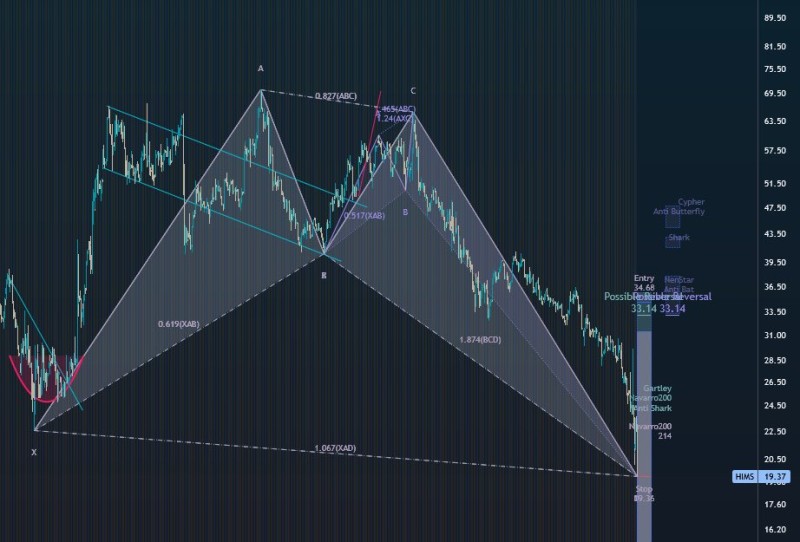
⬤ The pattern is built on multiple Fibonacci relationships, including a deep BCD extension that projects the completion zone near the lower boundary. With the current price hovering around $19.37—right at the pattern's completion area—the stock sits just above a key stop level at $19.36. Earlier price action showed the stock near $34.68 before pulling back through $33.14, illustrating the magnitude of the move that brought it to this technical zone.
⬤ This accumulation region marks where the harmonic structure becomes technically significant. The downward trend has carried the price directly into this range, matching the pattern's projected termination point and placing HIMS squarely within the defined buy zone highlighted by the formation.
⬤ What happens next depends entirely on how the stock behaves within this $17.5 to $20 window. Staying inside this range keeps the harmonic setup intact and could signal a potential reversal, while a break below would cancel out the pattern and suggest further downside ahead.
 Saad Ullah


