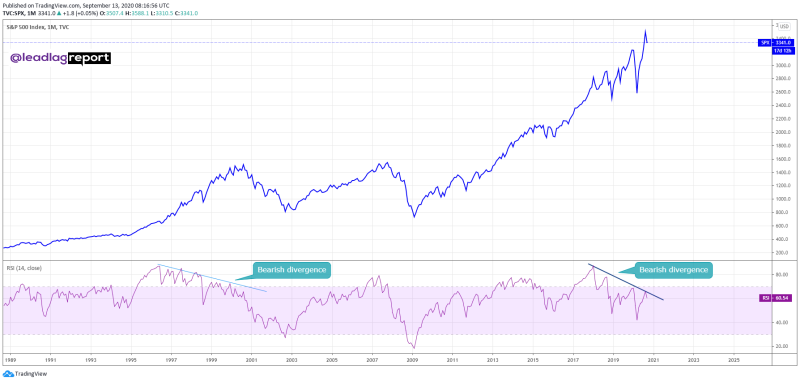
Bearish Divergence Comes
According to Michael A. Gayed, a portfolio risk manager and a market analyst, reports that the RSI technical indicator is showing bearish divergence on the S&P 500. The same divergence was seen just before the burst of the Dotcom bubble 20 years ago.
The RSI indicator on the S&P 500 has formed a bearish divergence on the monthly charts. A similar divergence was formed just before the dotcom bubble burst. #stocks #markets #economy #investing #financialservices #sp500 #bearishdivergence #correction #rsi Michael A. Gayed via Twitter

What is Bear Divergence and What is RSI Used For?
Divergence occurs when the price of a specific asset, in this case, the S&P 500 Index, moves in the opposite direction from a technical indicator.
If, as of right now, the asset's price is growing, and the indicator is decreasing, then this is called bearish divergence, as it is a sign that the trend may soon change to bearish, as the current upward movement is weakening.
RSI, or Relative Strenght Index, is a technical indicator that is used to measure the strength of the current trend in the price of an asset. For this, the average gain for all bullish periods, and the average decline for all bearish periods are considered, based on this, the indicator of Relative Strength is calculated.
Now the RSI is falling despite the market rally. This may indeed indicate a weakening trend.
 Sergey Diakov

 Sergey Diakov


